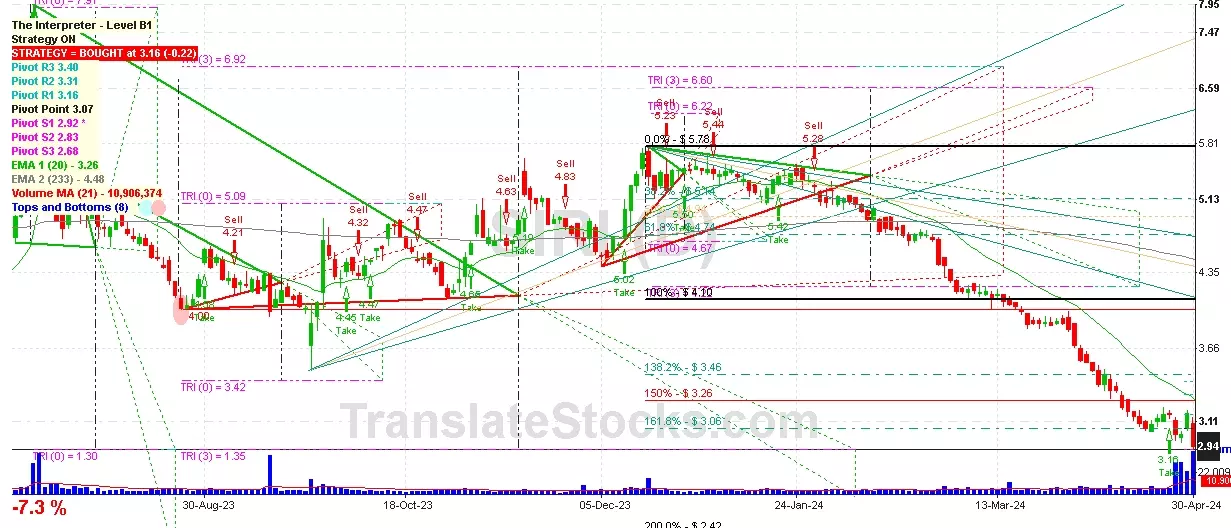
Hey Friend, I'm analysing SIRIUS XM HOLDINGS INC (SIRI), and it is between the Support of $ 2.92 (PivotS1) and the Resistance of $ 3.06 (161.8% of Fibonacci). The stock is also approaching the line of PivotS1 at $ 2.92, and if it goes below this line it could reach the next Support of 200% of Fibonacci at $ 2.42.

| Date | Price $ | Result % | Candle Name | Side |
|---|---|---|---|---|
| 001 07 Mar 2024 | Sell Price: 4.18 | Profit: Open Day1 ($ 4.15) | Dark Cloud Cover | Sell |
| 002 02 Feb 2024 | Sell Price: 5.17 | Profit: Open Day1 ($ 5.09) | Abandoned Baby | Sell |
| 003 02 Jan 2024 | Buy Price: 5.49 | Loss: Close Day2 ($ 5.43) | Piercing Line | Buy |
| 004 15 Dec 2023 | Sell Price: 5.40 | Profit: Close Day1 ($ 5.23) | Engulfing | Sell |
| 005 21 Nov 2023 | Sell Price: 4.85 | Loss: Close Day2 ($ 4.93) | Engulfing | Sell |
| 006 23 Oct 2023 | Buy Price: 4.48 | Profit: Open Day1 ($ 4.54) | Abandoned Baby | Buy |
| 007 05 Oct 2023 | Sell Price: 4.37 | Profit: Open Day1 ($ 4.34) | Dark Cloud Cover | Sell |
| 008 04 Oct 2023 | Buy Price: 4.45 | Profit: Open Day1 ($ 4.50) | Abandoned Baby | Buy |
| 009 27 Sep 2023 | Buy Price: 4.07 | Profit: Open Day1 ($ 4.16) | Abandoned Baby | Buy |
| 010 15 Sep 2023 | Sell Price: 3.99 | Loss: Close Day2 ($ 4.18) | Engulfing | Sell |
| 011 31 Aug 2023 | Sell Price: 4.40 | Profit: Close Day2 ($ 4.28) | Engulfing | Sell |
| 012 15 Aug 2023 | Buy Price: 4.71 | Loss: Close Day2 ($ 4.50) | Piercing Line | Buy |
| 013 10 Aug 2023 | Sell Price: 4.84 | Profit: Open Day1 ($ 4.79) | Dark Cloud Cover | Sell |
| 014 17 Jul 2023 | Buy Price: 4.94 | Profit: Close Day1 ($ 5.29) | Engulfing | Buy |
| 015 20 Jun 2023 | Sell Price: 3.75 | Profit: Close Day1 ($ 3.66) | Engulfing | Sell |
| 016 02 Jun 2023 | Sell Price: 3.58 | Loss: Close Day2 ($ 3.73) | Engulfing | Sell |
| 017One Year Average | Both Sides Result for 16 Signals |
Profit: $ 0.43 ($ 0.03 / Signal) |
All of Them | Buy + Sell |
| Simple Moving Averages (SMA) Period | Value $ | Signal | Exponential Moving Averages (EMA) Period | Value $ | Signal | |
|---|---|---|---|---|---|---|
| 2 | 3.06 | SELL | 2 | 3.00 | SELL | |
| 3 | 3.04 | SELL | 3 | 3.03 | SELL | |
| 5 | 3.06 | SELL | 5 | 3.05 | SELL | |
| 8 | 3.09 | SELL | 8 | 3.08 | SELL | |
| 13 | 3.11 | SELL | 13 | 3.15 | SELL | |
| 21 | 3.25 | SELL | 21 | 3.28 | SELL | |
| 34 | 3.51 | SELL | 34 | 3.50 | SELL | |
| 55 | 3.90 | SELL | 55 | 3.79 | SELL | |
| 90 | 4.45 | SELL | 90 | 4.08 | SELL | |
| 200 | 4.58 | SELL | 200 | 4.42 | SELL |
Sirius Xm Holdings Inc
IPO: 1994-09-13
Ticker: SIRIIndices: Nasdaq 100,
Exchange: Nasdaq Nms - Global Market (US - USD)
Website: https://www.siriusxm.com/corporate
Phone:
Common Stock
Technology (
Radio Broadcasting Stations
 Click to Enlarge