
| Date | Price $ | Result % | Candle Name | Side |
|---|---|---|---|---|
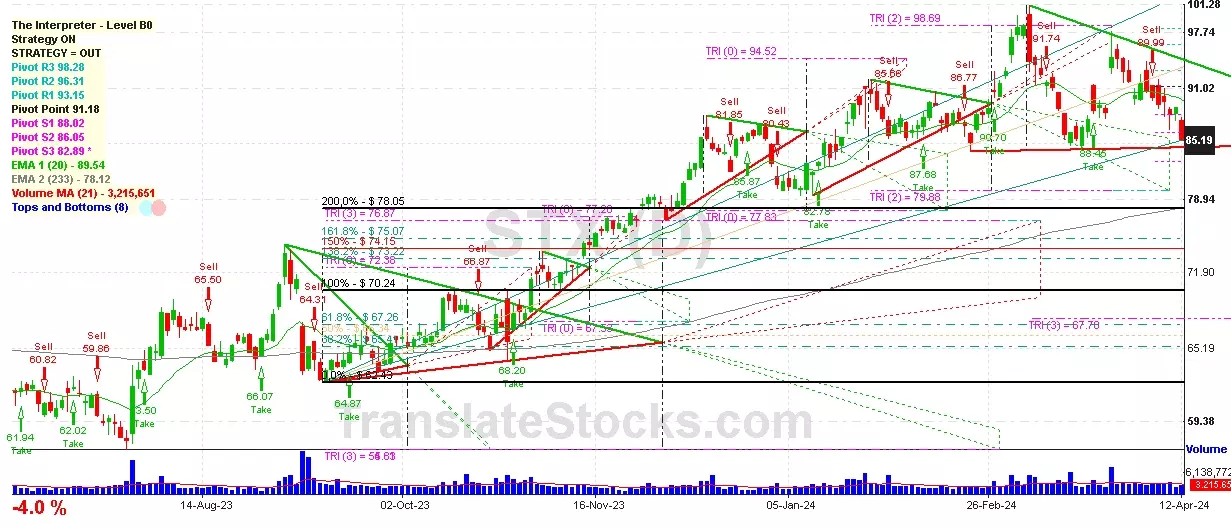
| 001 04 Apr 2024 | Sell Price: 90.76 | Profit: Close Day1 ($ 89.99) | Dark Cloud Cover | Sell |
| 002 26 Mar 2024 | Buy Price: 94.72 | Profit: Open Day1 ($ 95.66) | Abandoned Baby | Buy |
| 003 26 Jan 2024 | Sell Price: 90.44 | Profit: Close Day1 ($ 88.63) | Abandoned Baby | Sell |
| 004 04 Jan 2024 | Buy Price: 80.77 | Profit: Open Day1 ($ 81.13) | Piercing Line | Buy |
| 005 21 Dec 2023 | Buy Price: 85.30 | Profit: Open Day1 ($ 85.42) | Abandoned Baby | Buy |
| 006 13 Nov 2023 | Sell Price: 72.35 | Loss: Close Day2 ($ 74.55) | Abandoned Baby | Sell |
| 007 13 Nov 2023 | Buy Price: 72.47 | Profit: Open Day1 ($ 73.50) | Piercing Line | Buy |
| 008 25 Sep 2023 | Sell Price: 64.45 | Profit: Open Day1 ($ 64.20) | Abandoned Baby | Sell |
| 009 10 Aug 2023 | Buy Price: 67.15 | Profit: Close Day2 ($ 67.81) | Abandoned Baby | Buy |
| 010 21 Jul 2023 | Buy Price: 59.61 | Loss: Close Day2 ($ 58.24) | Abandoned Baby | Buy |
| 011One Year Average | Both Sides Result for 10 Signals |
Profit: $ 2.37 ($ 0.24 / Signal) |
All of Them | Buy + Sell |
| Simple Moving Averages (SMA) Period | Value $ | Signal | Exponential Moving Averages (EMA) Period | Value $ | Signal | |
|---|---|---|---|---|---|---|
| 2 | 86.65 | SELL | 2 | 86.38 | SELL | |
| 3 | 86.80 | SELL | 3 | 86.39 | SELL | |
| 5 | 86.42 | SELL | 5 | 86.17 | SELL | |
| 8 | 85.28 | BUY | 8 | 86.04 | BUY | |
| 13 | 85.52 | BUY | 13 | 86.31 | SELL | |
| 21 | 87.52 | SELL | 21 | 86.95 | SELL | |
| 34 | 88.10 | SELL | 34 | 87.57 | SELL | |
| 55 | 89.05 | SELL | 55 | 87.45 | SELL | |
| 90 | 87.48 | SELL | 90 | 85.77 | BUY | |
| 200 | 77.20 | BUY | 200 | 79.80 | BUY |
Seagate Technology Holdings
IPO: 2002-12-11
Ticker: STXIndices: S&P 500,
Exchange: Nasdaq Nms - Global Market (IE - USD)
Website: https://www.seagate.com/
Phone:
Common Stock
Technology (
Computer Storage Devices

 Click to Enlarge