| Date | Price $ | Result % | Candle Name | Side |
|---|---|---|---|---|
| 001 27 Mar 2024 | Buy Price: 60.72 | Loss: Close Day2 ($ 60.00) | Abandoned Baby | Buy |
| 002 18 Mar 2024 | Buy Price: 60.86 | Profit: Open Day1 ($ 60.97) | Abandoned Baby | Buy |
| 003 07 Mar 2024 | Sell Price: 60.36 | Profit: Open Day1 ($ 60.00) | Dark Cloud Cover | Sell |
| 004 21 Feb 2024 | Sell Price: 173.70 | Loss: Close Day2 ($ 175.56) | Abandoned Baby | Sell |
| 005 15 Feb 2024 | Buy Price: 169.29 | Profit: Open Day1 ($ 170.29) | Abandoned Baby | Buy |
| 006 13 Feb 2024 | Sell Price: 169.14 | Profit: Open Day1 ($ 168.75) | Engulfing | Sell |
| 007 12 Feb 2024 | Buy Price: 170.30 | Profit: Open Day1 ($ 170.62) | Engulfing | Buy |
| 008 04 Jan 2024 | Sell Price: 157.76 | Profit: Close Day1 ($ 156.71) | Abandoned Baby | Sell |
| 009 29 Nov 2023 | Sell Price: 156.08 | Profit: Open Day1 ($ 156.02) | Engulfing | Sell |
| 010 16 Nov 2023 | Sell Price: 156.04 | Profit: Open Day1 ($ 155.95) | Abandoned Baby | Sell |
| 011 23 Oct 2023 | Buy Price: 161.01 | Profit: Open Day1 ($ 161.40) | Engulfing | Buy |
| 012 20 Sep 2023 | Buy Price: 163.91 | Profit: Open Day1 ($ 164.26) | Abandoned Baby | Buy |
| 013 29 Jun 2023 | Sell Price: 154.28 | Loss: Close Day2 ($ 158.20) | Abandoned Baby | Sell |
| 014 26 May 2023 | Buy Price: 146.42 | Profit: Close Day2 ($ 146.87) | Piercing Line | Buy |
| 015One Year Average | Both Sides Result for 14 Signals |
Loss: $ -1.93 ($ -0.14 / Signal) |
All of Them | Buy + Sell |
| Simple Moving Averages (SMA) Period | Value $ | Signal | Exponential Moving Averages (EMA) Period | Value $ | Signal | |
|---|---|---|---|---|---|---|
| 2 | 60.25 | BUY | 2 | 60.35 | BUY | |
| 3 | 60.10 | BUY | 3 | 60.19 | BUY | |
| 5 | 59.77 | BUY | 5 | 60.02 | BUY | |
| 8 | 59.83 | BUY | 8 | 59.92 | BUY | |
| 13 | 59.80 | BUY | 13 | 59.91 | BUY | |
| 21 | 59.85 | BUY | 21 | 60.73 | SELL | |
| 34 | 60.00 | BUY | 34 | 65.27 | SELL | |
| 55 | 59.94 | BUY | 55 | 76.39 | SELL | |
| 90 | 57.89 | BUY | 90 | 93.10 | SELL | |
| 200 | 55.32 | BUY | 200 | 119.18 | SELL |
Common Stock
Trade & Services (
Retail-variety Stores

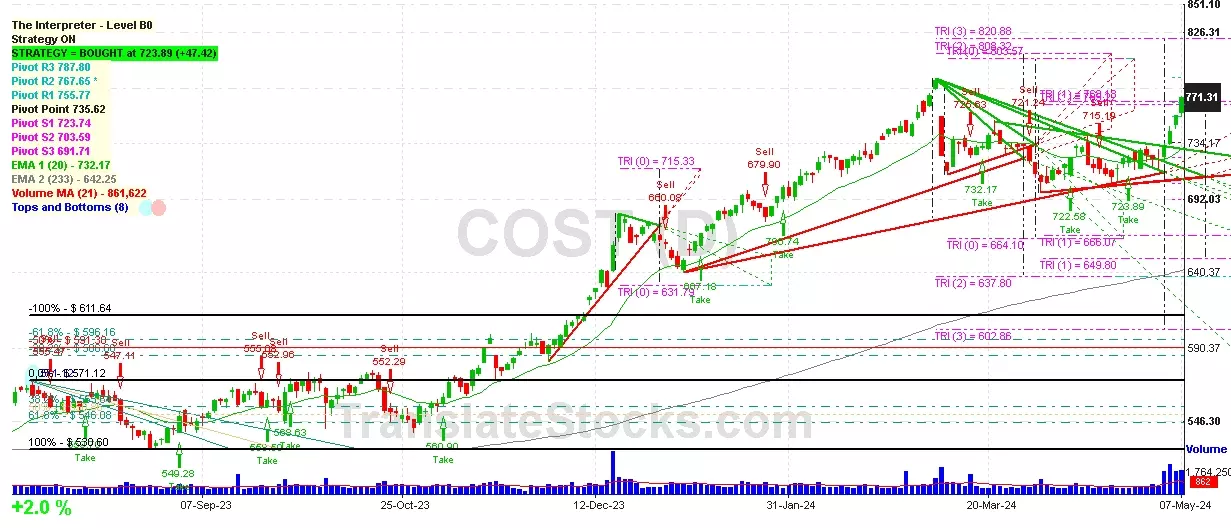
 Click to Enlarge
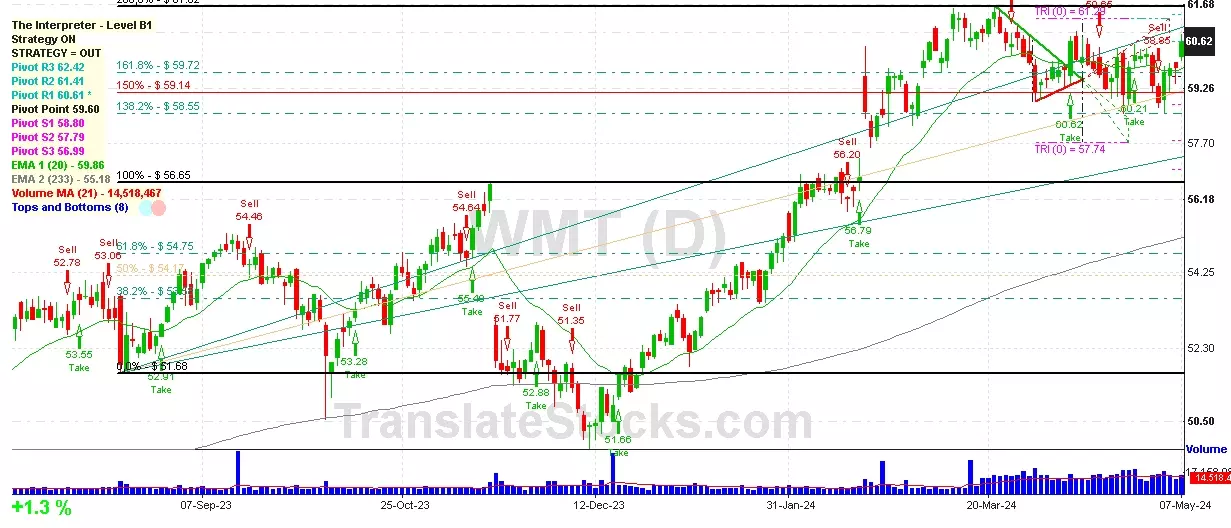