logo
  • The Interpreter

    Hey Friend, I'm analysing ARCHER DANIELS MIDLAND CO (ADM), and it is between the Support of $ 60.85 (PivotR1) and the Resistance of $ 62.54 (PivotR2). The stock is pointing upwards and could come close and reach $ 62.54 soon.

Archer daniels midland Co (ADM)

$ 60.18 +1.7%

Last Close 06-May-24

Next Support: $ 60.85


Pivot R1: $ 60.85
Fibonacci 61.8%: $ 59.97
Triangle Level (2): $ 58.59

Next Resistance: $ 62.54


Pivot R2: $ 62.54
Fibonacci 50%: $ 62.60
Triangle Level (1): $ 64.74


    Supports and Resistances
ImageClick to Enlarge
        

Date Price $ Result % Candle Name Side
001 22 Mar 2024 Sell Price: 62.00 Profit: Close Day2 ($ 61.81) Dark Cloud Cover Sell
002 04 Jan 2024 Sell Price: 71.75 Profit: Open Day1 ($ 71.37) Engulfing Sell
003 01 Nov 2023 Sell Price: 71.37 Loss: Close Day2 ($ 72.91) Engulfing Sell
004 24 May 2023 Sell Price: 72.85 Profit: Open Day1 ($ 72.20) Engulfing Sell
005One Year Average Both Sides Result for 4 Signals Loss: $ -0.32 ($ -0.08 / Signal)
-0.5% Gross in 1 Year
All of Them Buy + Sell

Trading Rules for Candlesticks Patterns.
  1. Buy or Sell on the same day of the signal, during the after-hours trading session.
  2. Watch the Opening and Closing of the next 2 days (4 in total).
  3. Immediately exit the Trade when one of them (Open or Close, Day 1 or 2) gives you a profit.
  4. The table above will show the first Profit opportunity, but not in real-time. Therefore, you must watch the market in real-time with your broker.
Remember: The returns an asset made in the past don't mean that future returns will be the same.

Find The Lastest Buy Signals for ADM Below.


Please Subscribe to See
The Latest Trade Signals


Bought Moving Averages

Sold Moving Averages

Simple Moving Averages (SMA) Period Value $ Signal   Exponential Moving Averages (EMA) Period Value $ Signal
260.89 BUY   261.01 BUY
360.32 BUY   360.64 BUY
559.73 BUY   560.30 BUY
859.77 BUY   860.24 BUY
1360.58 BUY   1360.43 BUY
2161.04 BUY   2160.61 BUY
3461.63 SELL   3460.51 BUY
5559.19 BUY   5560.61 BUY
9059.83 BUY   9061.86 SELL
20069.22 SELL   20066.77 SELL

Latest News +


Name & IPO

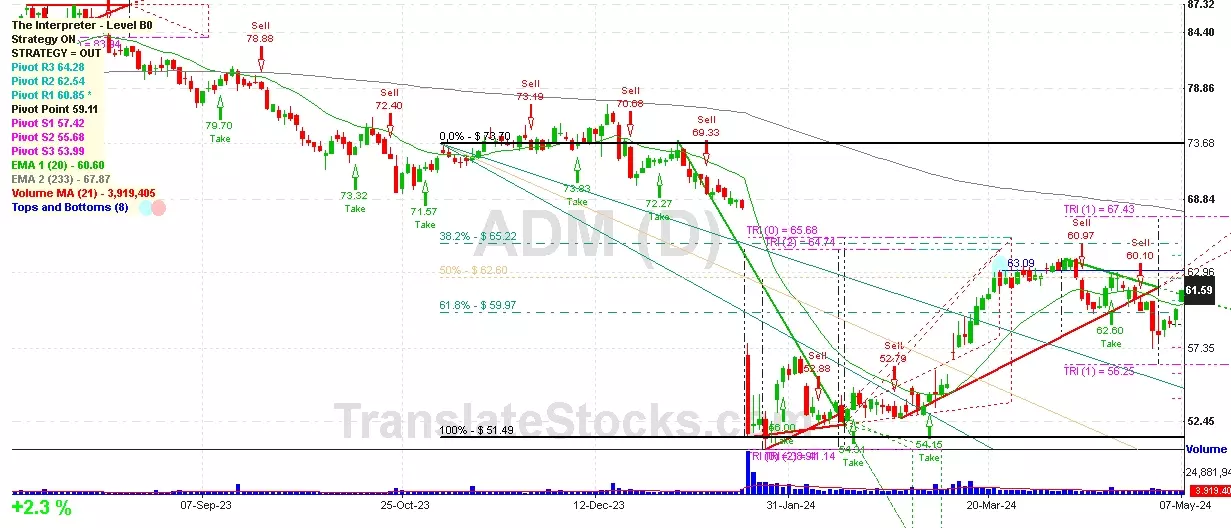
Archer-daniels-midland Co
IPO: 1924-12-24

Stock Ticker & Exchange

Ticker: ADMIndices: S&P 500,
Exchange: New York Stock Exchange, Inc. (US - USD)

Contact

Website: https://www.adm.com/
Phone:

Stock Type

Common Stock

SIC Office

Manufacturing ()

Industry

Fats & Oils

EIN

Fiscal Year End

State of Inc.


in USD millions (if not decimal) - Dictionary

in USD millions (if not decimal) - Dictionary

Statements sources
The financial statements are based on the company's filings with the The U.S. Securities and Exchange Commission (SEC) through the Electronic Data Gathering, Analysis, and Retrieval system (EDGAR). The information is derived from the 10-K and 10-Q reports submitted to the SEC in XBRL (eXtensible Business Reporting Language) format and presented according to the US GAAP Taxonomy. Please review the original filings for a more detailed information.

SEC Filings (click for details)   SEC Filings Web Page for Archer daniels midland Co

Stock Peers for ADM

Settings
Color Scheme

Left Sidebar