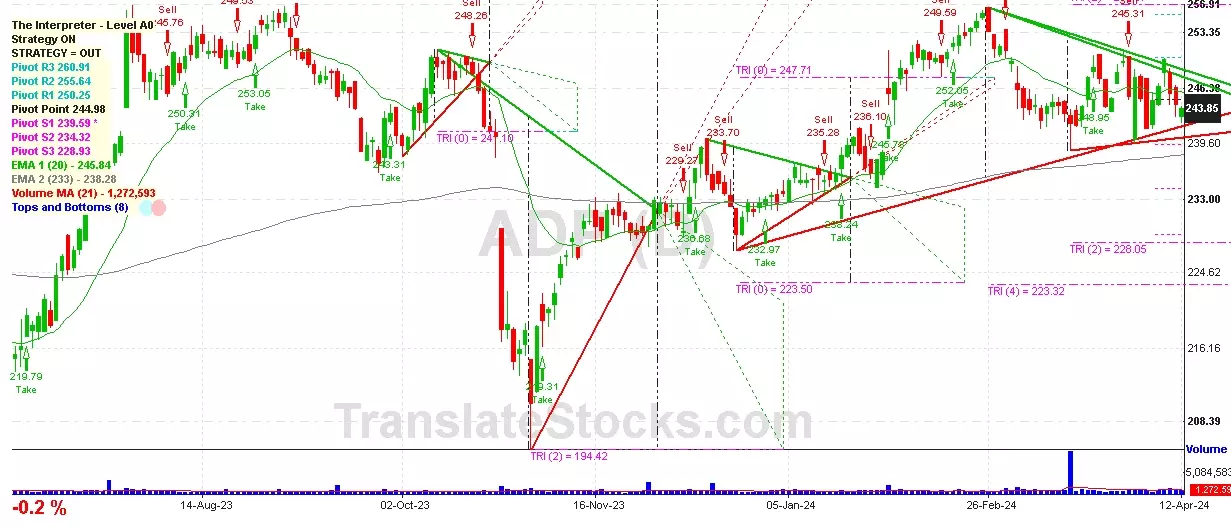
Hey Friend, I'm analysing AUTOMATIC DATA PROCESSING (ADP), and it is between the Support of $ 241.10 (Triangle Projection Level 0) and the Resistance of $ 244.98 (Pivot). The stock is also approaching the line of Pivot at $ 244.98, and if it goes above this line it could reach the next Resistance of Triangle projection at $247.71.

| Date | Price $ | Result % | Candle Name | Side |
|---|---|---|---|---|
| 001 01 Apr 2024 | Sell Price: 245.31 | Profit: Open Day1 ($ 240.11) | Engulfing | Sell |
| 002 22 Mar 2024 | Sell Price: 247.61 | Profit: Open Day1 ($ 247.42) | Engulfing | Sell |
| 003 03 Jan 2024 | Sell Price: 232.51 | Loss: Close Day2 ($ 235.21) | Engulfing | Sell |
| 004 16 Nov 2023 | Sell Price: 229.91 | Profit: Close Day1 ($ 229.39) | Engulfing | Sell |
| 005 03 Oct 2023 | Buy Price: 240.21 | Profit: Open Day1 ($ 241.29) | Engulfing | Buy |
| 006 03 Oct 2023 | Buy Price: 240.42 | Profit: Open Day1 ($ 241.29) | Piercing Line | Buy |
| 007 31 Aug 2023 | Sell Price: 254.61 | Profit: Close Day2 ($ 252.85) | Engulfing | Sell |
| 008 29 Aug 2023 | Sell Price: 254.35 | Loss: Close Day2 ($ 254.61) | Abandoned Baby | Sell |
| 009 30 May 2023 | Sell Price: 210.12 | Profit: Close Day1 ($ 208.99) | Engulfing | Sell |
| 010 08 May 2023 | Sell Price: 214.27 | Profit: Open Day1 ($ 213.93) | Engulfing | Sell |
| 011One Year Average | Both Sides Result for 10 Signals |
Profit: $ 8.13 ($ 0.81 / Signal) |
All of Them | Buy + Sell |
| Simple Moving Averages (SMA) Period | Value $ | Signal | Exponential Moving Averages (EMA) Period | Value $ | Signal | |
|---|---|---|---|---|---|---|
| 2 | 244.71 | SELL | 2 | 244.18 | SELL | |
| 3 | 245.34 | SELL | 3 | 244.67 | SELL | |
| 5 | 245.83 | SELL | 5 | 244.94 | SELL | |
| 8 | 244.67 | SELL | 8 | 244.98 | SELL | |
| 13 | 244.59 | SELL | 13 | 245.02 | SELL | |
| 21 | 245.26 | SELL | 21 | 245.18 | SELL | |
| 34 | 245.20 | SELL | 34 | 245.30 | SELL | |
| 55 | 247.07 | SELL | 55 | 244.82 | SELL | |
| 90 | 243.29 | SELL | 90 | 243.42 | SELL | |
| 200 | 241.45 | BUY | 200 | 239.63 | BUY |
Automatic Data Processing
IPO: 1961-09-01
Ticker: ADPIndices: S&P 500,
Nasdaq 100,
Exchange: Nasdaq Nms - Global Market (US - USD)
Website: https://www.adp.com/
Phone:
Common Stock
Technology (
Services-computer Processing & Data Preparation
 Click to Enlarge