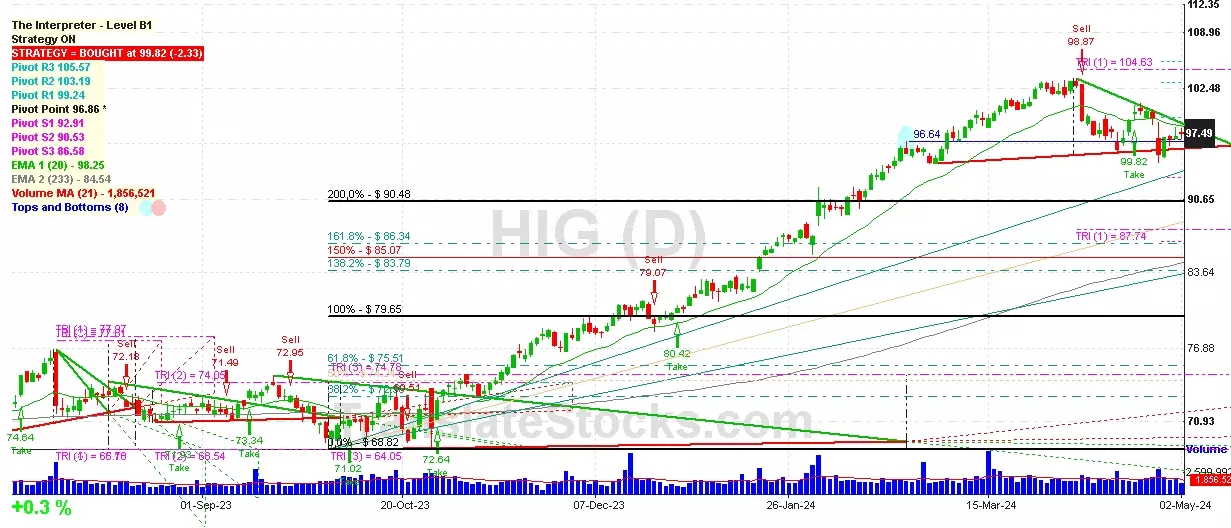
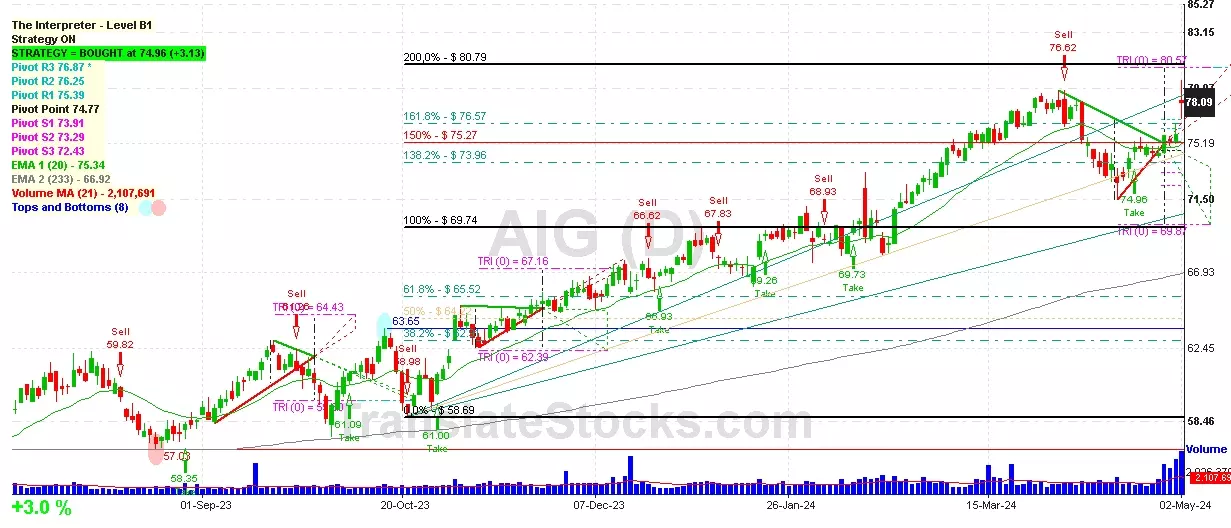
Hey Friend, I'm analysing AMERICAN INTERNATIONAL GROUP (AIG), and it is between the Support of $ 76.87 (PivotR3) and the Resistance of $ 80.57 (Triangle Projection Level 0). The stock is also approaching the line of PivotR3 at $ 76.87, and if it goes below this line it could reach the next Support of 161.8% of Fibonacci at $ 76.57.

| Date | Price $ | Result % | Candle Name | Side |
|---|---|---|---|---|
| 001 18 Apr 2024 | Buy Price: 72.99 | Profit: Open Day1 ($ 73.43) | Abandoned Baby | Buy |
| 002 02 Apr 2024 | Buy Price: 78.02 | Profit: Open Day1 ($ 78.18) | Engulfing | Buy |
| 003 22 Mar 2024 | Sell Price: 76.38 | Loss: Close Day2 ($ 77.40) | Engulfing | Sell |
| 004 11 Mar 2024 | Buy Price: 74.91 | Profit: Open Day1 ($ 74.92) | Engulfing | Buy |
| 005 12 Oct 2023 | Sell Price: 61.14 | Profit: Close Day1 ($ 61.09) | Engulfing | Sell |
| 006 26 Jun 2023 | Buy Price: 55.67 | Profit: Close Day1 ($ 56.45) | Abandoned Baby | Buy |
| 007One Year Average | Both Sides Result for 6 Signals |
Profit: $ 0.42 ($ 0.07 / Signal) |
All of Them | Buy + Sell |
| Simple Moving Averages (SMA) Period | Value $ | Signal | Exponential Moving Averages (EMA) Period | Value $ | Signal | |
|---|---|---|---|---|---|---|
| 2 | 78.29 | BUY | 2 | 78.07 | BUY | |
| 3 | 77.46 | BUY | 3 | 77.64 | BUY | |
| 5 | 76.69 | BUY | 5 | 76.98 | BUY | |
| 8 | 75.95 | BUY | 8 | 76.37 | BUY | |
| 13 | 75.17 | BUY | 13 | 75.89 | BUY | |
| 21 | 75.16 | BUY | 21 | 75.61 | BUY | |
| 34 | 75.89 | BUY | 34 | 75.20 | BUY | |
| 55 | 74.74 | BUY | 55 | 74.25 | BUY | |
| 90 | 72.35 | BUY | 90 | 72.44 | BUY | |
| 200 | 66.58 | BUY | 200 | 67.95 | BUY |
American International Group
IPO: 1984-10-08
Ticker: AIGIndices: S&P 500,
Exchange: New York Stock Exchange, Inc. (US - USD)
Website: http://www.aig.com
Phone:
Common Stock
Finance (
Fire, Marine & Casualty Insurance
 Click to Enlarge