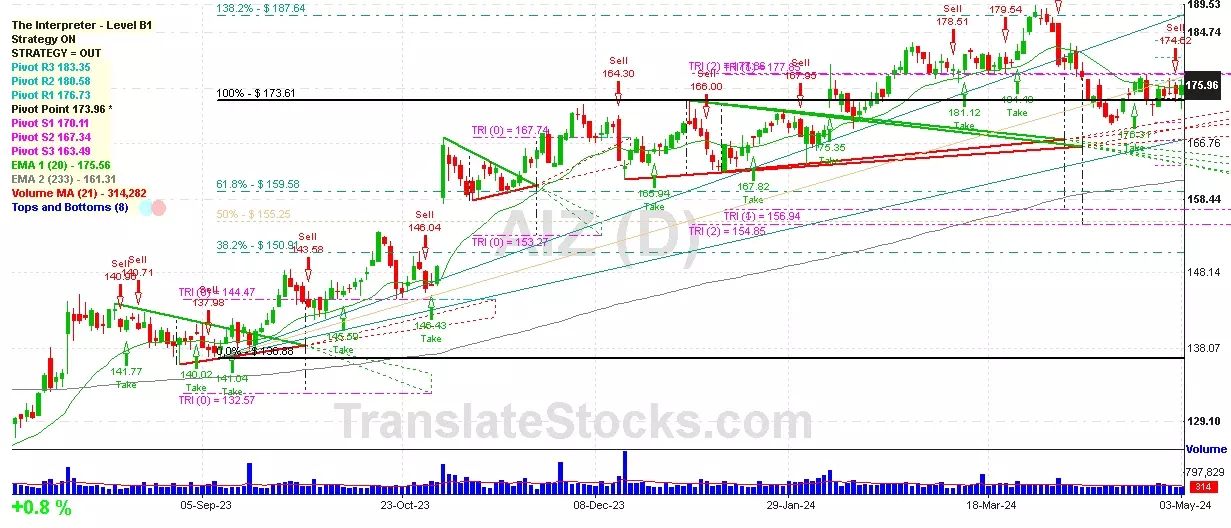
Hey Friend, I'm analysing ASSURANT INC (AIZ), and it is between the Support of $ 173.96 (Pivot) and the Resistance of $ 176.73 (PivotR1). The stock is also approaching the line of PivotR1 at $ 176.73, and if it goes above this line it could reach the next Resistance of Triangle projection at $177.85.

| Date | Price $ | Result % | Candle Name | Side |
|---|---|---|---|---|
| 001 29 Apr 2024 | Buy Price: 175.45 | Loss: Close Day2 ($ 174.65) | Abandoned Baby | Buy |
| 002 29 Apr 2024 | Buy Price: 175.32 | Loss: Close Day2 ($ 174.65) | Engulfing | Buy |
| 003 01 Apr 2024 | Sell Price: 187.22 | Profit: Close Day1 ($ 186.62) | Abandoned Baby | Sell |
| 004 15 Mar 2024 | Buy Price: 181.16 | Loss: Close Day2 ($ 179.16) | Engulfing | Buy |
| 005 14 Mar 2024 | Sell Price: 179.82 | Profit: Open Day1 ($ 178.76) | Abandoned Baby | Sell |
| 006 29 Feb 2024 | Sell Price: 181.45 | Profit: Close Day1 ($ 180.46) | Engulfing | Sell |
| 007 01 Feb 2024 | Buy Price: 169.30 | Loss: Close Day2 ($ 168.39) | Piercing Line | Buy |
| 008 27 Dec 2023 | Sell Price: 166.24 | Profit: Open Day1 ($ 166.17) | Abandoned Baby | Sell |
| 009 13 Sep 2023 | Sell Price: 138.84 | Profit: Close Day2 ($ 138.71) | Engulfing | Sell |
| 010 16 Aug 2023 | Buy Price: 141.90 | Profit: Open Day1 ($ 142.20) | Engulfing | Buy |
| 011 16 Aug 2023 | Buy Price: 141.77 | Profit: Open Day1 ($ 142.20) | Piercing Line | Buy |
| 012 18 Jul 2023 | Buy Price: 126.48 | Profit: Close Day1 ($ 128.01) | Engulfing | Buy |
| 013 14 Jul 2023 | Sell Price: 125.96 | Profit: Open Day1 ($ 124.80) | Engulfing | Sell |
| 014 06 Jul 2023 | Buy Price: 124.67 | Profit: Close Day1 ($ 125.86) | Piercing Line | Buy |
| 015One Year Average | Both Sides Result for 14 Signals |
Profit: $ 3.08 ($ 0.22 / Signal) |
All of Them | Buy + Sell |
| Simple Moving Averages (SMA) Period | Value $ | Signal | Exponential Moving Averages (EMA) Period | Value $ | Signal | |
|---|---|---|---|---|---|---|
| 2 | 175.29 | BUY | 2 | 175.48 | BUY | |
| 3 | 175.08 | BUY | 3 | 175.24 | BUY | |
| 5 | 174.99 | BUY | 5 | 174.98 | BUY | |
| 8 | 174.82 | BUY | 8 | 174.82 | BUY | |
| 13 | 174.17 | BUY | 13 | 174.98 | BUY | |
| 21 | 174.91 | BUY | 21 | 175.61 | BUY | |
| 34 | 177.92 | SELL | 34 | 176.21 | SELL | |
| 55 | 178.20 | SELL | 55 | 175.78 | BUY | |
| 90 | 174.52 | BUY | 90 | 173.12 | BUY | |
| 200 | 160.85 | BUY | 200 | 163.38 | BUY |
Assurant Inc
IPO: 2004-02-05
Ticker: AIZIndices: S&P 500,
Exchange: New York Stock Exchange, Inc. (US - USD)
Website: https://www.assurant.com/
Phone:
Common Stock
Finance (
Insurance Carriers, Nec
 Click to Enlarge