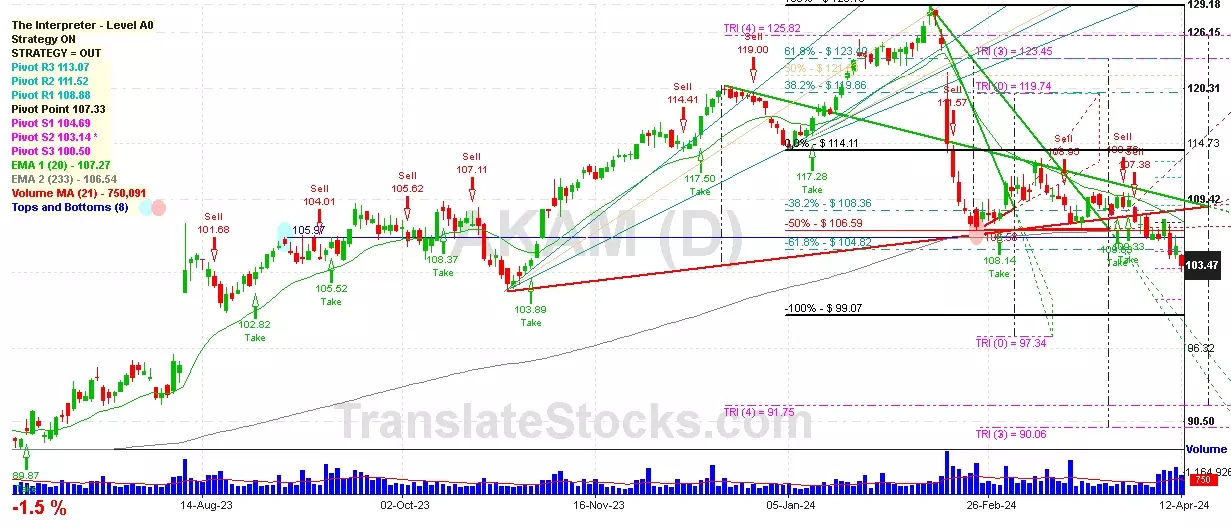
Hey Friend, I'm analysing AKAMAI TECHNOLOGIES INC (AKAM), and it is between the Support of $ 103.14 (PivotS2) and the Resistance of $ 104.69 (PivotS1). The stock is also approaching the line of PivotS2 at $ 103.14, and if it goes below this line it could reach the next Support of -100% of Fibonacci at $ 99.07.

| Date | Price $ | Result % | Candle Name | Side |
|---|---|---|---|---|
| 001 12 Feb 2024 | Sell Price: 128.15 | Profit: Open Day1 ($ 125.52) | Dark Cloud Cover | Sell |
| 002 15 Nov 2023 | Sell Price: 112.06 | Profit: Open Day1 ($ 112.00) | Dark Cloud Cover | Sell |
| 003 05 Sep 2023 | Sell Price: 104.55 | Profit: Open Day1 ($ 104.51) | Abandoned Baby | Sell |
| 004 18 Aug 2023 | Buy Price: 100.90 | Profit: Open Day1 ($ 101.00) | Piercing Line | Buy |
| 005One Year Average | Both Sides Result for 4 Signals |
Profit: $ 2.83 ($ 0.71 / Signal) |
All of Them | Buy + Sell |
| Simple Moving Averages (SMA) Period | Value $ | Signal | Exponential Moving Averages (EMA) Period | Value $ | Signal | |
|---|---|---|---|---|---|---|
| 2 | 101.74 | SELL | 2 | 101.74 | SELL | |
| 3 | 101.89 | SELL | 3 | 101.74 | SELL | |
| 5 | 101.66 | BUY | 5 | 101.73 | SELL | |
| 8 | 101.36 | BUY | 8 | 101.92 | SELL | |
| 13 | 102.10 | SELL | 13 | 102.57 | SELL | |
| 21 | 104.07 | SELL | 21 | 103.77 | SELL | |
| 34 | 105.90 | SELL | 34 | 105.60 | SELL | |
| 55 | 108.63 | SELL | 55 | 107.78 | SELL | |
| 90 | 113.12 | SELL | 90 | 109.25 | SELL | |
| 200 | 108.77 | SELL | 200 | 107.02 | SELL |
Akamai Technologies Inc
IPO: 1999-10-29
Ticker: AKAMIndices: S&P 500,
Exchange: Nasdaq Nms - Global Market (US - USD)
Website: https://www.akamai.com/
Phone:
Common Stock
Trade & Services (
Services-business Services, Nec
 Click to Enlarge