| Date | Price $ | Result % | Candle Name | Side |
|---|---|---|---|---|
| 001 01 Apr 2024 | Sell Price: 319.65 | Profit: Open Day1 ($ 312.41) | Abandoned Baby | Sell |
| 002 26 Mar 2024 | Buy Price: 319.94 | Profit: Open Day1 ($ 325.10) | Abandoned Baby | Buy |
| 003 18 Mar 2024 | Buy Price: 316.14 | Profit: Close Day1 ($ 317.20) | Abandoned Baby | Buy |
| 004 11 Mar 2024 | Sell Price: 308.09 | Loss: Close Day2 ($ 320.69) | Abandoned Baby | Sell |
| 005 04 Mar 2024 | Buy Price: 308.04 | Loss: Close Day2 ($ 303.79) | Abandoned Baby | Buy |
| 006 27 Nov 2023 | Sell Price: 216.75 | Profit: Close Day1 ($ 214.14) | Abandoned Baby | Sell |
| 007 22 Aug 2023 | Buy Price: 351.63 | Profit: Open Day1 ($ 353.55) | Engulfing | Buy |
| 008 11 Aug 2023 | Buy Price: 352.86 | Profit: Close Day1 ($ 360.49) | Engulfing | Buy |
| 009 11 Aug 2023 | Buy Price: 352.88 | Profit: Close Day1 ($ 360.49) | Piercing Line | Buy |
| 010 26 Jun 2023 | Buy Price: 331.46 | Profit: Open Day1 ($ 333.29) | Engulfing | Buy |
| 011 23 Jun 2023 | Sell Price: 328.83 | Profit: Open Day1 ($ 328.01) | Abandoned Baby | Sell |
| 012One Year Average | Both Sides Result for 11 Signals |
Profit: $ 19.03 ($ 1.73 / Signal) |
All of Them | Buy + Sell |
| Simple Moving Averages (SMA) Period | Value $ | Signal | Exponential Moving Averages (EMA) Period | Value $ | Signal | |
|---|---|---|---|---|---|---|
| 2 | 285.53 | BUY | 2 | 286.52 | BUY | |
| 3 | 284.48 | BUY | 3 | 288.10 | SELL | |
| 5 | 293.46 | SELL | 5 | 291.73 | SELL | |
| 8 | 300.43 | SELL | 8 | 295.75 | SELL | |
| 13 | 300.76 | SELL | 13 | 300.11 | SELL | |
| 21 | 307.86 | SELL | 21 | 304.09 | SELL | |
| 34 | 312.34 | SELL | 34 | 305.94 | SELL | |
| 55 | 311.13 | SELL | 55 | 303.38 | SELL | |
| 90 | 296.39 | SELL | 90 | 297.50 | SELL | |
| 200 | 290.74 | SELL | 200 | 292.79 | SELL |
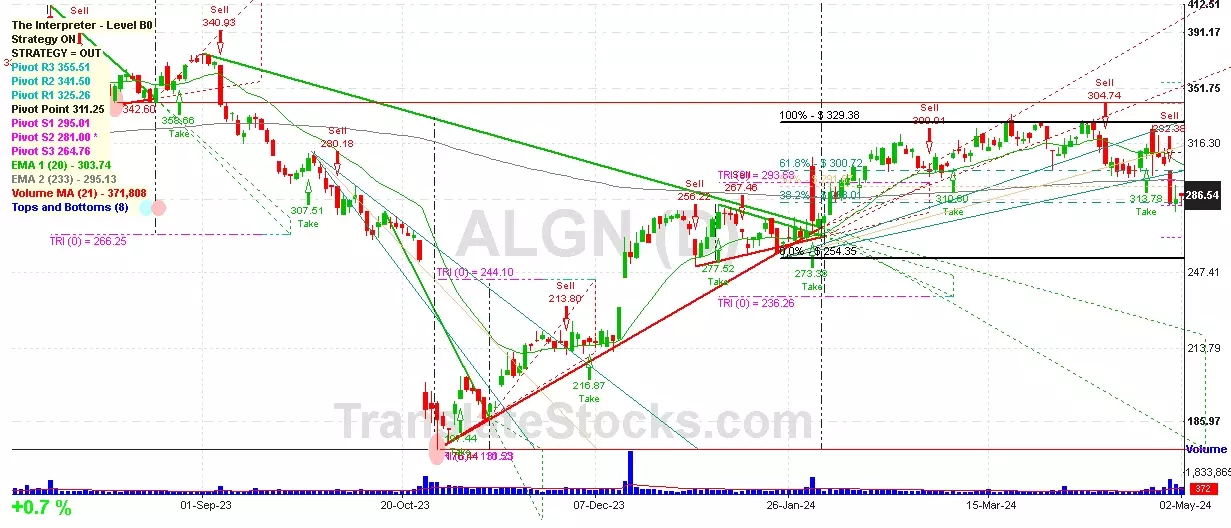
Align Technology Inc
IPO: 2001-01-26
Ticker: ALGNIndices: S&P 500,
Nasdaq 100,
Exchange: Nasdaq Nms - Global Market (US - USD)
Website: http://www.aligntech.com/
Phone:
Common Stock
Life Sciences (
Orthopedic, Prosthetic & Surgical Appliances & Supplies

 Click to Enlarge