
| Date | Price $ | Result % | Candle Name | Side |
|---|---|---|---|---|
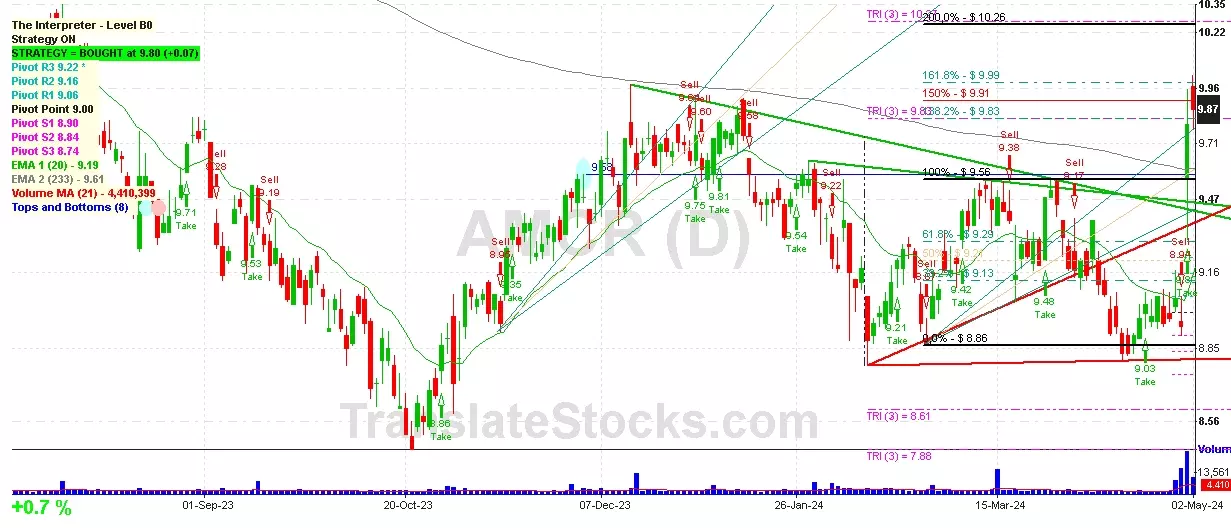
| 001 21 Mar 2024 | Buy Price: 9.28 | Profit: Open Day1 ($ 9.29) | Abandoned Baby | Buy |
| 002 15 Mar 2024 | Buy Price: 9.48 | Loss: Close Day2 ($ 9.39) | Engulfing | Buy |
| 003 14 Mar 2024 | Sell Price: 9.43 | Profit: Open Day1 ($ 9.36) | Abandoned Baby | Sell |
| 004 29 Feb 2024 | Buy Price: 9.06 | Profit: Close Day1 ($ 9.09) | Abandoned Baby | Buy |
| 005 26 Feb 2024 | Sell Price: 9.14 | Profit: Open Day1 ($ 9.07) | Abandoned Baby | Sell |
| 006 12 Feb 2024 | Buy Price: 9.18 | Loss: Close Day2 ($ 8.95) | Abandoned Baby | Buy |
| 007 28 Nov 2023 | Sell Price: 9.30 | Loss: Close Day2 ($ 9.48) | Dark Cloud Cover | Sell |
| 008 26 Oct 2023 | Buy Price: 8.68 | Profit: Open Day1 ($ 8.73) | Engulfing | Buy |
| 009 25 Sep 2023 | Buy Price: 9.19 | Loss: Close Day2 ($ 9.04) | Engulfing | Buy |
| 010 13 Sep 2023 | Sell Price: 9.21 | Loss: Close Day2 ($ 9.35) | Abandoned Baby | Sell |
| 011 26 Jul 2023 | Sell Price: 10.15 | Loss: Close Day2 ($ 10.22) | Abandoned Baby | Sell |
| 012 20 Jul 2023 | Sell Price: 9.94 | Loss: Close Day2 ($ 10.12) | Engulfing | Sell |
| 013 20 Jul 2023 | Sell Price: 9.95 | Loss: Close Day2 ($ 10.12) | Dark Cloud Cover | Sell |
| 014 18 Jul 2023 | Buy Price: 9.95 | Profit: Close Day1 ($ 9.98) | Engulfing | Buy |
| 015 06 Jul 2023 | Buy Price: 9.83 | Profit: Close Day1 ($ 9.94) | Piercing Line | Buy |
| 016 19 May 2023 | Buy Price: 10.23 | Profit: Close Day1 ($ 10.27) | Abandoned Baby | Buy |
| 017One Year Average | Both Sides Result for 16 Signals |
Loss: $ -0.80 ($ -0.05 / Signal) |
All of Them | Buy + Sell |
| Simple Moving Averages (SMA) Period | Value $ | Signal | Exponential Moving Averages (EMA) Period | Value $ | Signal | |
|---|---|---|---|---|---|---|
| 2 | 9.84 | BUY | 2 | 9.75 | BUY | |
| 3 | 9.54 | BUY | 3 | 9.63 | BUY | |
| 5 | 9.33 | BUY | 5 | 9.46 | BUY | |
| 8 | 9.20 | BUY | 8 | 9.32 | BUY | |
| 13 | 9.09 | BUY | 13 | 9.23 | BUY | |
| 21 | 9.10 | BUY | 21 | 9.18 | BUY | |
| 34 | 9.19 | BUY | 34 | 9.18 | BUY | |
| 55 | 9.19 | BUY | 55 | 9.21 | BUY | |
| 90 | 9.32 | BUY | 90 | 9.26 | BUY | |
| 200 | 9.33 | BUY | 200 | 9.51 | BUY |
Amcor Plc
IPO: 2019-06-11
Ticker: AMCRIndices: S&P 500,
Exchange: New York Stock Exchange, Inc. (GB - USD)
Website: https://www.amcor.com/
Phone:
Common Stock
Manufacturing (
Miscellaneous Manufacturing Industries
Year | 2021 | 2020 | 2019 | 2018 | 2017 | 2016 | |
|---|---|---|---|---|---|---|---|
| 1 | Assets + | 17,188 | 16,442 | 17,165 | 9,058 | 3,609 | 516 |
| 2 | Real Estate Investment Property + | 221 | 197 | 184 | 156 | 0 | 0 |
| 3 | Real Estate Investment Property + | 221 | 197 | 184 | 156 | 0 | 0 |
| 4 | Investments in and Advance to Affiliates + | 0 | 78 | 99 | 116 | 0 | 0 |
| 5 | Cash and Cash Equivalents + | 850 | 743 | 602 | 621 | 562 | 516 |
| 6 | Property + | 7,292 | 6,688 | 3,975 | 2,698 | 0 | 0 |
| 7 | Property + | 7,292 | 6,688 | 7,104 | 5,700 | 0 | 0 |
| 8 | Intangible Assets + | 1,835 | 1,994 | 2,307 | 325 | 0 | 0 |
| 9 | Finite-Lived Intangible Assets + | 1,835 | 1,994 | 2,307 | 325 | 0 | 0 |
| 10 | Liabilities and Equity + | 17,188 | 16,442 | 17,165 | 9,058 | 588 | 528 |
| 11 | Liabilities + | 12,367 | 11,755 | 11,490 | 8,362 | 0 | 0 |
| 12 | Debt and Lease Obligation + | 98 | 195 | 789 | 1,174 | 0 | 0 |
| 13 | Stockholders' Equity + | 4,821 | 4,687 | 5,675 | 695 | 588 | 528 |
| 14 | Stockholders' Equity Attributable to Parent + | 4,764 | 4,626 | 5,609 | 627 | 0 | 0 |
| 15 | Stockholders' Equity + | 0.01 | 0.01 | 0.01 | 0 | 0 | 0 |
| 16 | Common Stock + | 0.01 | 0.01 | 0.01 | 0 | 0 | 0 |
| 17 | Partners' Capital + | 452 | 246 | 324 | 561 | 0 | 0 |
| 18 | Partners' Capital + | 452 | 246 | 324 | 561 | 0 | 0 |
| 19 | Limited Liability Company (LLC) Members' Equity + | -314 | -803 | -398 | -147 | 0 | 0 |
| 20 | Limited Liability Company (LLC) Members' Equity + | -314 | -803 | -398 | -147 | 0 | 0 |
| 21 | Current Assets + | 5,266 | 4,535 | 5,210 | 3,620 | 0 | 0 |
| 22 | Current Other Undisclosed Receivables | 1,411 | 1,087 | 0 | 882 | 0 | 0 |
| 23 | Current Receivables + | 3,275 | 2,703 | 1,864 | 2,261 | 0 | 0 |
| 24 | Inventory + | 1,991 | 1,832 | 1,954 | 1,359 | 0 | 0 |
| 25 | Current Disposal Group + | 0 | 0 | 416 | 0 | 0 | 0 |
| 26 | Current Assets Held-for-sale + | 0 | 0 | 416 | 0 | 0 | 0 |
| 27 | Long-Term Assets + | 11,922 | 11,907 | 11,955 | 5,437 | 3,047 | 0 |
| 28 | Current Liabilities + | 4,345 | 3,974 | 4,542 | 5,055 | 0 | 0 |
| 29 | Long-Term Liabilities + | 8,022 | 7,781 | 6,948 | 2,873 | 0 | 0 |
| 30 | Increase (Decrease) in Stockholders' Equity [Roll Forward] + | -29 | -67 | -16 | -11 | 0 | 0 |
| 31 | Treasury Stock Transactions + | -29 | -67 | -16 | -11 | 0 | 0 |
| 32 | Treasury Stock + | -29 | -67 | -16 | -11 | 0 | 0 |
| 33 | Total Current Assets + | 5,266 | 4,535 | 5,210 | 3,620 | 0 | 0 |
| 34 | Operating Lease + | 532 | 525 | 0 | 0 | 0 | 0 |
| 35 | Finance Lease + | 562 | 556 | 0 | 0 | 0 | 0 |
| 36 | Goodwill + | 5,419 | 5,339 | 5,156 | 2,057 | 2,060 | 0 |
| 37 | Long-Term Other Assets + | 184 | 177 | 187 | 118 | 0 | 0 |
| 38 | Deferred Income Tax Assets + | 323 | 312 | 378 | 0 | 0 | 0 |
| 39 | Assets for Plan Benefits + | 2,082 | 2,003 | 2,009 | 1,057 | 3,047 | 0 |
| 40 | Total Long-Term Assets + | 11,922 | 11,907 | 11,955 | 5,437 | 0 | 0 |
| 41 | Total Assets + | 17,188 | 16,442 | 17,165 | 9,058 | 0 | 0 |
| 42 | Total Liabilities + | 12,367 | 11,755 | 11,490 | 8,362 | 0 | 0 |
| 43 | Stockholders' Equity Attributable to Noncontrolling Interest + | 57 | 61 | 66 | 69 | 0 | 0 |
| 44 | Total Stockholders' Equity + | 4,821 | 4,687 | 5,675 | 695 | 588 | 528 |
| 45 | Total Liabilities and Equity + | 17,188 | 16,442 | 17,165 | 9,058 | 0 | 0 |
Year | 2021 | 2020 | 2019 | 2018 | 2017 | 2016 | |
|---|---|---|---|---|---|---|---|
| 1 | 0 | 12,468 | 9,458 | 9,319 | 9,101 | 0 | |
| 2 | -10,129 | -9,932 | -7,659 | -7,462 | -7,189 | 0 | |
| 3 | 2,732 | 2,536 | 1,799 | 1,857 | 1,912 | 0 | |
| 4 | 100 | 97 | 64 | 73 | 69 | 0 | |
| 5 | 389 | 403 | 0 | 0 | 0 | 0 | |
| 6 | 3 | 5 | 2 | 2 | 64 | 0 | |
| 7 | 1,292 | 1,385 | 999 | 793 | 850 | 0 | |
| 8 | -4 | 5 | 0 | 0 | 0 | 0 | |
| 9 | 10 | 4 | 16 | 18 | 0 | 0 | |
| 10 | 0 | 0 | 16 | 18 | 10 | 0 | |
| 11 | 44 | 0 | 159 | 0 | 0 | 0 | |
| 12 | 53 | 0 | 0 | 0 | 0 | 0 | |
| 13 | 1,321 | 994 | 792 | 994 | 916 | 0 | |
| 14 | 14 | 22 | 17 | 13 | 12 | 0 | |
| 15 | -21 | 16 | 5 | -86 | 0 | 0 | |
| 16 | 11 | 16 | 4 | -74 | 0 | 0 | |
| 17 | 0 | 0 | 4 | -74 | -22 | 0 | |
| 18 | 1 | 1 | 0 | 0 | 0 | 0 | |
| 19 | 153 | 207 | 208 | 210 | 191 | 0 | |
| 20 | 19 | -14 | 4 | -18 | 14 | 0 | |
| 21 | 1,193 | 825 | 604 | 723 | 716 | 0 | |
| 22 | -261 | -187 | -172 | -119 | -149 | 0 | |
| 23 | 0 | -7 | 1 | 0 | 0 | 0 | |
| 24 | 0 | -8 | 1 | 0 | 0 | 0 | |
| 25 | 951 | 617 | 437 | 587 | 581 | 0 | |
| 26 | -12 | -4 | -7 | -11 | -17 | 0 | |
| 27 | Total Net Income (Loss) Attributable to Parent + | 939 | 612 | 430 | 575 | 564 | 0 |
| 28 | 937 | 612 | 429 | 574 | 0 | 0 | |
| 29 | Total Income (Loss) from Continuing Operations + | 951 | 624 | 437 | 587 | 581 | 0 |
| 30 | Total Income (Loss) from Discontinued Operations + | 0 | -8 | 1 | 0 | 0 | 0 |
| 31 | Income (Loss) from Continuing Operations + | 0.60 | 0.39 | 0.36 | 0.50 | 0.49 | 0 |
| 32 | 0 | 0 | 0 | 0 | 0 | 0 | |
| 33 | 0 | 0 | 0 | 0 | 0 | 0 | |
| 34 | Total Earnings Per Share + | 0.60 | 0.38 | 0.36 | 0.50 | 0.49 | 0 |
| 35 | Income (Loss) from Continuing Operations + | 0.60 | 0.39 | 0.36 | 0.50 | 0.49 | 0 |
| 36 | Income (Loss) from Continuing Operations + | 0.60 | 0.39 | 0.36 | 0.49 | 0.48 | 0 |
| 37 | 0 | 0 | 0 | 0 | 0 | 0 | |
| 38 | Total Earnings Per Share + | 0.60 | 0.38 | 0.36 | 0.49 | 0.48 | 0 |
| 39 | 0.47 | 0.46 | 0.58 | 0.45 | 0.42 | 0 | |
| 40 | 0 | -7 | 1 | 0 | 0 | 0 |

 Click to Enlarge