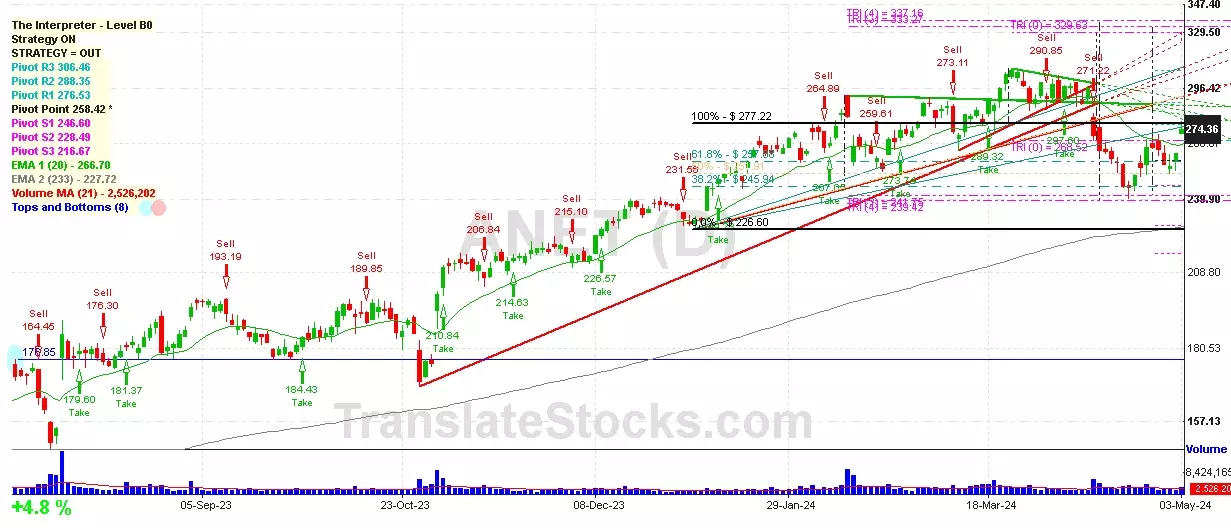
Hey Friend, I'm analysing ARISTA NETWORKS INC (ANET), and it is between the Support of $ 268.52 (Triangle Projection Level 0) and the Resistance of $ 276.53 (PivotR1). The stock is also approaching the line of PivotR1 at $ 276.53, and if it goes above this line it could reach the next Resistance of 100% of Fibonacci at $ 277.22.

| Date | Price $ | Result % | Candle Name | Side |
|---|---|---|---|---|
| 001 12 Mar 2024 | Buy Price: 281.86 | Profit: Close Day2 ($ 284.02) | Abandoned Baby | Buy |
| 002 05 Mar 2024 | Sell Price: 280.47 | Loss: Close Day2 ($ 286.57) | Abandoned Baby | Sell |
| 003 12 Feb 2024 | Sell Price: 280.88 | Profit: Open Day1 ($ 257.89) | Engulfing | Sell |
| 004 17 Jan 2024 | Sell Price: 248.99 | Loss: Close Day2 ($ 263.50) | Abandoned Baby | Sell |
| 005 15 Nov 2023 | Sell Price: 213.74 | Profit: Open Day1 ($ 209.49) | Engulfing | Sell |
| 006 15 Nov 2023 | Sell Price: 213.89 | Profit: Open Day1 ($ 209.49) | Dark Cloud Cover | Sell |
| 007 08 Aug 2023 | Buy Price: 180.45 | Profit: Open Day1 ($ 180.52) | Engulfing | Buy |
| 008 07 Aug 2023 | Sell Price: 179.13 | Profit: Open Day1 ($ 179.00) | Engulfing | Sell |
| 009 07 Aug 2023 | Sell Price: 179.27 | Profit: Open Day1 ($ 179.00) | Dark Cloud Cover | Sell |
| 010 17 Jul 2023 | Buy Price: 170.42 | Profit: Close Day1 ($ 173.51) | Engulfing | Buy |
| 011 31 May 2023 | Sell Price: 166.34 | Profit: Open Day1 ($ 165.80) | Abandoned Baby | Sell |
| 012One Year Average | Both Sides Result for 11 Signals |
Profit: $ 17.29 ($ 1.57 / Signal) |
All of Them | Buy + Sell |
| Simple Moving Averages (SMA) Period | Value $ | Signal | Exponential Moving Averages (EMA) Period | Value $ | Signal | |
|---|---|---|---|---|---|---|
| 2 | 268.11 | BUY | 2 | 269.64 | BUY | |
| 3 | 263.81 | BUY | 3 | 267.05 | BUY | |
| 5 | 262.33 | BUY | 5 | 264.41 | BUY | |
| 8 | 261.99 | BUY | 8 | 262.99 | BUY | |
| 13 | 258.08 | BUY | 13 | 263.83 | BUY | |
| 21 | 267.94 | BUY | 21 | 267.12 | BUY | |
| 34 | 278.54 | SELL | 34 | 270.46 | BUY | |
| 55 | 277.11 | SELL | 55 | 270.18 | BUY | |
| 90 | 269.00 | BUY | 90 | 262.99 | BUY | |
| 200 | 228.75 | BUY | 200 | 235.40 | BUY |
Arista Networks Inc
IPO: 2014-06-06
Ticker: ANETIndices: S&P 500,
Exchange: New York Stock Exchange, Inc. (US - USD)
Website: https://www.arista.com/en/
Phone:
Common Stock
Technology (
Computer Communications Equipment
 Click to Enlarge