
| Date | Price $ | Result % | Candle Name | Side |
|---|---|---|---|---|
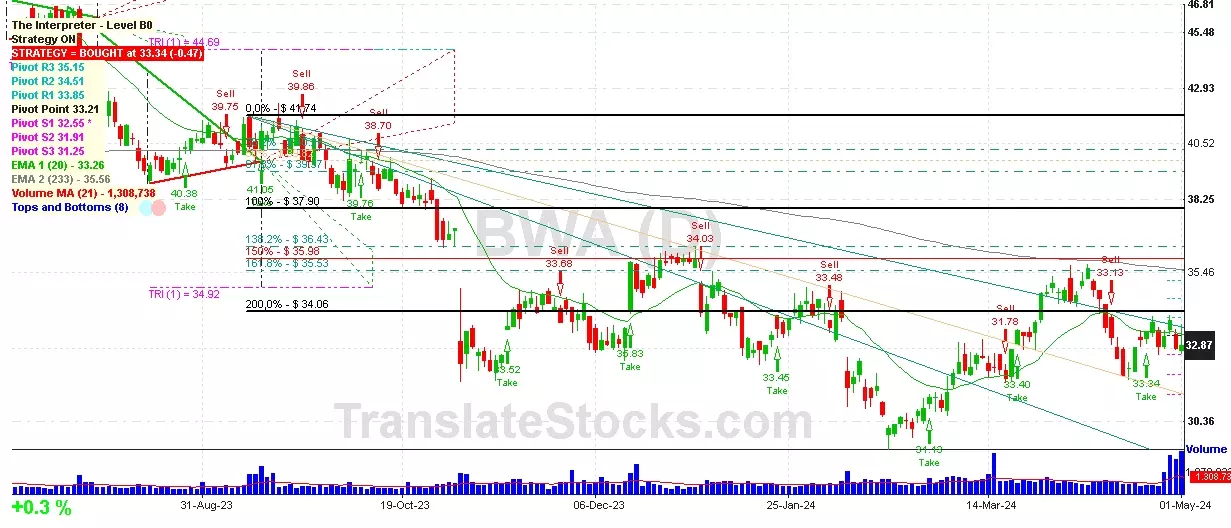
| 001 02 Apr 2024 | Sell Price: 34.74 | Profit: Open Day1 ($ 34.48) | Abandoned Baby | Sell |
| 002 08 Mar 2024 | Sell Price: 32.04 | Profit: Open Day1 ($ 31.89) | Dark Cloud Cover | Sell |
| 003 27 Feb 2024 | Buy Price: 30.68 | Profit: Close Day1 ($ 30.78) | Abandoned Baby | Buy |
| 004 19 Jan 2024 | Buy Price: 32.87 | Profit: Open Day1 ($ 33.08) | Piercing Line | Buy |
| 005 26 Oct 2023 | Buy Price: 38.26 | Loss: Close Day2 ($ 36.71) | Abandoned Baby | Buy |
| 006 12 Oct 2023 | Sell Price: 39.25 | Profit: Close Day1 ($ 38.70) | Abandoned Baby | Sell |
| 007 23 Aug 2023 | Buy Price: 39.84 | Profit: Open Day2 ($ 39.89) | Piercing Line | Buy |
| 008 27 Jul 2023 | Sell Price: 45.80 | Loss: Close Day2 ($ 46.50) | Dark Cloud Cover | Sell |
| 009 18 Jul 2023 | Buy Price: 45.65 | Profit: Open Day1 ($ 45.90) | Abandoned Baby | Buy |
| 010 11 Jul 2023 | Buy Price: 45.57 | Profit: Open Day1 ($ 46.26) | Engulfing | Buy |
| 011 20 Jun 2023 | Sell Price: 46.39 | Profit: Open Day1 ($ 46.35) | Abandoned Baby | Sell |
| 012 25 May 2023 | Buy Price: 46.86 | Profit: Open Day1 ($ 47.11) | Engulfing | Buy |
| 013One Year Average | Both Sides Result for 12 Signals |
Profit: $ 0.30 ($ 0.02 / Signal) |
All of Them | Buy + Sell |
| Simple Moving Averages (SMA) Period | Value $ | Signal | Exponential Moving Averages (EMA) Period | Value $ | Signal | |
|---|---|---|---|---|---|---|
| 2 | 32.82 | BUY | 2 | 32.92 | SELL | |
| 3 | 33.12 | SELL | 3 | 32.99 | SELL | |
| 5 | 33.08 | SELL | 5 | 33.05 | SELL | |
| 8 | 33.18 | SELL | 8 | 33.10 | SELL | |
| 13 | 32.91 | SELL | 13 | 33.19 | SELL | |
| 21 | 33.58 | SELL | 21 | 33.26 | SELL | |
| 34 | 33.49 | SELL | 34 | 33.23 | SELL | |
| 55 | 32.61 | BUY | 55 | 33.23 | SELL | |
| 90 | 33.17 | SELL | 90 | 33.60 | SELL | |
| 200 | 36.18 | SELL | 200 | 35.21 | SELL |
Borgwarner Inc
IPO: 1993-08-13
Ticker: BWAIndices: S&P 500,
Exchange: New York Stock Exchange, Inc. (US - USD)
Website: https://www.borgwarner.com/
Phone:
Common Stock
Manufacturing (
Motor Vehicle Parts & Accessories
Year | 2020 | 2019 | 2018 | 2017 | 2016 | 2015 | 2014 | 2013 | 2012 | 2011 | 2010 | 2009 | 2008 | 2007 | 2006 | |
|---|---|---|---|---|---|---|---|---|---|---|---|---|---|---|---|---|
| 1 | Assets + | 16,029 | 9,702 | 10,095 | 9,788 | 8,835 | 8,842 | 7,228 | 6,917 | 6,401 | 5,959 | 5,555 | 4,811 | 4,644 | 188 | 123 |
| 2 | Real Estate Investment Property + | 0 | 0 | 0 | 0 | 0 | 0 | 0 | 0 | 0 | 0 | 68 | 56 | 0 | 0 | 0 |
| 3 | Real Estate Investment Property + | 0 | 0 | 0 | 0 | 0 | 0 | 0 | 0 | 0 | 0 | 68 | 56 | 0 | 0 | 0 |
| 4 | Investments in and Advance to Affiliates + | 769 | 512 | 244 | 240 | 219 | 200 | 184 | 202 | 218 | 217 | 205 | 195 | 0 | 0 | 0 |
| 5 | Cash and Cash Equivalents + | 1,650 | 832 | 739 | 545 | 444 | 578 | 798 | 940 | 716 | 360 | 450 | 357 | 103 | 188 | 123 |
| 6 | Property + | 0 | 2,925 | 2,904 | 2,864 | 2,502 | 2,448 | 2,094 | 1,939 | 1,788 | 1,664 | 1,543 | 1,490 | 1,586 | 0 | 0 |
| 7 | Property + | 0 | 4,192 | 4,150 | 4,046 | 3,495 | 3,328 | 3,044 | 2,926 | 3,246 | 2,904 | 2,761 | 2,622 | 0 | 0 | 0 |
| 8 | Intangible Assets + | 1,096 | 402 | 440 | 493 | 464 | 544 | 151 | 170 | 206 | 243 | 169 | 149 | -83 | 0 | 0 |
| 9 | Finite-Lived Intangible Assets + | 930 | 347 | 384 | 433 | 409 | 463 | 133 | 140 | 170 | 200 | 124 | 111 | -83 | 0 | 0 |
| 10 | Liabilities and Equity + | 16,029 | 9,702 | 10,095 | 9,788 | 8,835 | 8,842 | 7,228 | 6,917 | 6,401 | 5,959 | 5,555 | 4,811 | 4,644 | 0 | 0 |
| 11 | Liabilities + | 3,810 | 2,329 | 2,399 | 2,425 | 2,092 | 2,357 | 2,168 | 1,624 | 1,603 | 1,905 | 1,514 | 1,110 | 1,250 | 0 | 0 |
| 12 | Debt and Lease Obligation + | 0 | 0 | 0 | 0 | 0 | 0 | 0 | 0 | 0 | 0 | 122 | 64 | 0 | 0 | 0 |
| 13 | Stockholders' Equity + | 6,724 | 4,844 | 4,345 | 3,826 | 3,302 | 3,632 | 3,691 | 3,632 | 3,146 | 2,453 | 2,310 | 2,223 | 2,038 | 0 | 0 |
| 14 | Stockholders' Equity Attributable to Parent + | 6,428 | 4,706 | 4,226 | 3,717 | 3,218 | 3,554 | 3,616 | 3,561 | 3,083 | 2,388 | 2,259 | 2,185 | 2,006 | 0 | 0 |
| 15 | Stockholders' Equity + | 0.02 | 0.02 | 0.02 | 0.02 | 0.02 | 0.02 | 0.02 | 0.02 | 0.02 | 0.02 | 0.02 | 0.02 | 0.02 | 0 | 0 |
| 16 | Preferred Stock + | 0.01 | 0.01 | 0.01 | 0.01 | 0.01 | 0.01 | 0.01 | 0.01 | 0.01 | 0.01 | 0.01 | 0.01 | 0.01 | 0 | 0 |
| 17 | Common Stock + | 0.01 | 0.01 | 0.01 | 0.01 | 0.01 | 0.01 | 0.01 | 0.01 | 0.01 | 0.01 | 0.01 | 0.01 | 0.01 | 0 | 0 |
| 18 | Partners' Capital + | 6,296 | 5,942 | 5,336 | 4,531 | 4,215 | 4,210 | 3,717 | 3,177 | 2,611 | 2,110 | 1,560 | 1,193 | 1,200 | 0 | 0 |
| 19 | Partners' Capital + | 6,296 | 5,942 | 5,336 | 4,531 | 4,215 | 4,210 | 3,717 | 3,177 | 2,611 | 2,110 | 1,560 | 1,193 | 1,200 | 0 | 0 |
| 20 | Limited Liability Company (LLC) Members' Equity + | 5,645 | 5,215 | 4,662 | 4,041 | 3,493 | 3,600 | 3,333 | 3,163 | 2,490 | 1,959 | 1,506 | 1,207 | 1,114 | 0 | 0 |
| 21 | Limited Liability Company (LLC) Members' Equity + | 5,645 | 5,215 | 4,662 | 4,041 | 3,493 | 3,600 | 3,333 | 3,163 | 2,490 | 1,959 | 1,506 | 1,207 | 1,114 | 0 | 0 |
| 22 | Current Assets + | 6,167 | 3,836 | 3,805 | 3,543 | 2,912 | 3,135 | 2,971 | 2,798 | 2,473 | 2,138 | 2,060 | 1,552 | 1,308 | 0 | 0 |
| 23 | Cash + | 0 | 0 | 0 | 0 | 0 | 12 | 0 | 0 | 0 | 0 | 0 | 0 | 0 | 0 | 0 |
| 24 | Current Receivables + | 2,919 | 1,921 | 1,987 | 2,019 | 1,689 | 1,665 | 1,444 | 1,248 | 1,147 | 1,183 | 1,024 | 732 | 607 | 0 | 0 |
| 25 | Inventory + | 1,286 | 807 | 781 | 766 | 641 | 724 | 506 | 458 | 448 | 454 | 431 | 314 | 451 | 0 | 0 |
| 26 | Current Prepaid Expense + | 84 | 83 | 83 | 82 | 78 | 98 | 72 | 37 | 39 | 24 | 22 | 26 | 0 | 0 | 0 |
| 27 | Current Contract with Customer + | 16 | 10 | 0 | 0 | 0 | 0 | 0 | 0 | 0 | 0 | 0 | 0 | 0 | 0 | 0 |
| 28 | Derivative Instruments and Hedges + | 0 | 0 | 0 | 0 | 0 | 0 | 0 | 3 | 6 | 3 | 3 | 20 | 0 | 0 | 0 |
| 29 | Current Disposal Group + | 0 | 0 | 39 | 38 | 0 | 0 | 0 | 0 | 0 | 0 | 0 | 0 | 0 | 0 | 0 |
| 30 | Long-Term Assets + | 3,869 | 2,386 | 2,355 | 2,341 | 2,455 | 2,254 | 1,760 | 1,774 | 1,757 | 1,811 | 1,645 | 1,511 | 1,483 | 0 | 0 |
| 31 | Long-term Investments and Receivables + | 820 | 318 | 592 | 308 | 283 | 261 | 219 | 204 | 165 | 128 | 103 | 63 | 266 | 0 | 0 |
| 32 | Long-Term Disposal Group + | 0 | 0 | 45 | 48 | 0 | 0 | 0 | 0 | 0 | 0 | 0 | 0 | 0 | 0 | 0 |
| 33 | Current Liabilities + | 3,810 | 2,329 | 2,399 | 2,425 | 2,092 | 2,357 | 2,168 | 1,624 | 1,603 | 1,905 | 1,392 | 1,046 | 1,250 | 0 | 0 |
| 34 | Long-Term Liabilities + | 5,429 | 3,270 | 3,709 | 3,893 | 3,717 | 3,329 | 1,759 | 2,047 | 2,021 | 2,033 | 2,272 | 1,104 | 813 | 0 | 0 |
| 35 | Increase (Decrease) in Stockholders' Equity [Roll Forward] + | -1,834 | -1,657 | -1,585 | -1,445 | -1,382 | -1,158 | -832 | -727 | -569 | -707 | -350 | -58 | -87 | 0 | 0 |
| 36 | Treasury Stock Transactions + | -1,834 | -1,657 | -1,585 | -1,445 | -1,382 | -1,158 | -832 | -727 | -569 | -707 | -350 | -58 | -87 | 0 | 0 |
| 37 | Treasury Stock + | -1,834 | -1,657 | -1,585 | -1,445 | -1,382 | -1,158 | -832 | -727 | -569 | -707 | -350 | -58 | -87 | 0 | 0 |
| 38 | Current Other Assets + | 72 | 98 | 83 | 58 | 52 | 46 | 40 | 31 | 22 | 27 | 24 | 23 | 0 | 0 | 0 |
| 39 | Total Current Assets + | 6,167 | 3,836 | 3,805 | 3,543 | 2,912 | 3,135 | 2,971 | 2,798 | 2,473 | 2,138 | 2,060 | 1,552 | 1,308 | 0 | 0 |
| 40 | Operating Lease + | 211 | 85 | 0 | 0 | 0 | 0 | 0 | 0 | 0 | 0 | 0 | 0 | 0 | 0 | 0 |
| 41 | Finance Lease + | 223 | 86 | 0 | 0 | 0 | 0 | 0 | 0 | 0 | 0 | 0 | 0 | 0 | 0 | 0 |
| 42 | Goodwill + | 2,627 | 1,842 | 1,853 | 1,882 | 1,702 | 1,758 | 1,206 | 1,197 | 1,181 | 1,186 | 1,114 | 1,061 | 1,052 | 0 | 0 |
| 43 | Long-Term Other Assets + | 728 | 379 | 502 | 459 | 753 | 496 | 554 | 577 | 576 | 625 | 531 | 450 | 431 | 0 | 0 |
| 44 | Deferred Income Tax Assets + | 1,019 | 458 | 0 | 0 | 0 | 0 | 0 | 0 | 0 | 0 | 0 | 0 | 0 | 0 | 0 |
| 45 | Total Assets + | 16,029 | 9,702 | 10,095 | 9,788 | 8,835 | 8,842 | 7,228 | 6,917 | 6,401 | 5,959 | 5,555 | 4,811 | 4,644 | 0 | 0 |
| 46 | Stockholders' Equity Attributable to Noncontrolling Interest + | 296 | 138 | 119 | 109 | 84 | 78 | 75 | 72 | 64 | 65 | 51 | 37 | 32 | 0 | 0 |
| 47 | Total Stockholders' Equity + | 6,724 | 4,844 | 4,345 | 3,826 | 3,302 | 3,632 | 3,691 | 3,632 | 3,146 | 2,453 | 2,310 | 2,223 | 2,038 | 0 | 0 |
| 48 | Total Liabilities and Equity + | 16,029 | 9,702 | 10,095 | 9,788 | 8,835 | 8,842 | 7,228 | 6,917 | 6,401 | 5,959 | 5,555 | 4,811 | 4,644 | 0 | 0 |
Year | 2020 | 2019 | 2018 | 2017 | 2016 | 2015 | 2014 | 2013 | 2012 | 2011 | 2010 | 2009 | 2008 | 2007 | |
|---|---|---|---|---|---|---|---|---|---|---|---|---|---|---|---|
| 1 | 10,165 | 10,168 | 10,530 | 9,799 | 9,071 | 8,023 | 8,305 | 7,437 | 7,183 | 7,115 | 0 | 0 | 0 | 0 | |
| 2 | -8,255 | -8,067 | -8,300 | -7,684 | -7,142 | 0 | 0 | 0 | 0 | 0 | 0 | 0 | 0 | 0 | |
| 3 | 1,910 | 2,101 | 2,229 | 2,120 | 1,933 | 1,703 | 1,756 | 1,558 | 1,467 | 1,410 | 1,093 | 561 | 838 | 950 | |
| 4 | 476 | 413 | 440 | 408 | 343 | 307 | 336 | 303 | 266 | 244 | 185 | 155 | 206 | 0 | |
| 5 | 568 | 439 | 431 | 0 | 0 | 0 | 303 | 273 | 260 | 252 | 224 | 235 | 260 | 243 | |
| 6 | 0 | 0 | 0 | 10 | 24 | 22 | 0 | 0 | 0 | 0 | 0 | 0 | 0 | 0 | |
| 7 | 4 | 27 | 0 | 0 | 0 | 48 | 3 | 0 | -6 | 0 | 0 | 0 | 0 | 0 | |
| 8 | 0 | 0 | 0 | 0 | 0 | 13 | 0 | 0 | 0 | 0 | 0 | 0 | 0 | 0 | |
| 9 | 0 | 0 | 0 | -2 | 0 | 0 | 0 | 0 | 0 | 0 | -22 | 0 | -4 | 0 | |
| 10 | 0 | 14 | 0 | 0 | -6 | 0 | 0 | 0 | 0 | -29 | 14 | 0 | 0 | 0 | |
| 11 | 0 | 0 | 0 | 0 | 0 | 0 | 0 | 0 | 0 | -29 | 16 | 0 | 0 | 0 | |
| 12 | 951 | 873 | 946 | 898 | 818 | 662 | 699 | 640 | 629 | 621 | 567 | 460 | 0 | 0 | |
| 13 | 11 | 1 | 5 | 0 | 0 | 0 | 0 | 0 | 0 | 0 | 0 | 0 | 0 | 0 | |
| 14 | 0 | 0 | 19 | 0 | 0 | 0 | 0 | 0 | 0 | 0 | 0 | 0 | 0 | 0 | |
| 15 | 0 | 0 | 0 | -5 | 0 | 0 | 0 | 0 | 0 | 0 | 0 | 0 | 0 | 0 | |
| 16 | -17 | -7 | -26 | -76 | -127 | 0 | 0 | 0 | -32 | -22 | 0 | 0 | 0 | 0 | |
| 17 | 4 | 2 | 4 | 0 | 4 | 0 | 0 | 0 | 0 | 0 | 0 | 0 | 0 | 0 | |
| 18 | 618 | 1,303 | 1,190 | 1,077 | 226 | 940 | 964 | 855 | 753 | 798 | 504 | 51 | 7 | 418 | |
| 19 | 0 | -7 | 0 | 0 | 0 | 0 | 0 | 0 | -40 | -22 | 0 | 0 | 0 | 0 | |
| 20 | 0 | -3 | 1 | -1 | 0 | 0 | 0 | 0 | 0 | 0 | 0 | 0 | 0 | 0 | |
| 21 | 12 | 12 | 6 | 6 | 6 | 8 | 6 | 5 | 5 | 5 | 3 | 2 | 7 | 7 | |
| 22 | 0 | 0 | 4 | 0 | 6 | 0 | 0 | 0 | 0 | 0 | 0 | 0 | 0 | 0 | |
| 23 | 7 | -27 | 13 | 5 | 11 | 0 | 0 | 0 | 0 | 0 | 0 | 0 | 0 | 0 | |
| 24 | 0 | 0 | -3 | 0 | 4 | 1 | 10 | 7 | 0 | 0 | 0 | 0 | 0 | 0 | |
| 25 | -73 | -55 | -59 | -70 | -85 | -60 | -36 | -34 | -39 | -75 | -69 | -57 | -39 | -35 | |
| 26 | 964 | 1,265 | 1,196 | 1,064 | 190 | 927 | 980 | 869 | 761 | 766 | 478 | 18 | 14 | 430 | |
| 27 | 18 | 32 | 49 | 51 | 43 | 40 | 47 | 44 | 43 | 38 | 40 | 22 | 0 | 0 | |
| 28 | 964 | 1,265 | 1,196 | 1,064 | 190 | 927 | 980 | 869 | 761 | 766 | 0 | 0 | 0 | 0 | |
| 29 | -397 | -468 | -211 | -580 | -30 | -280 | -293 | -218 | -239 | -195 | -82 | 18 | -33 | -114 | |
| 30 | 567 | 797 | 985 | 483 | 160 | 646 | 688 | 651 | 522 | 571 | 396 | 36 | -19 | 316 | |
| 31 | -67 | -51 | -54 | -43 | -42 | -37 | -32 | -27 | -22 | -20 | -19 | -9 | -16 | -28 | |
| 32 | Total Net Income (Loss) Attributable to Parent + | 500 | 746 | 931 | 440 | 118 | 610 | 656 | 624 | 501 | 550 | 377 | 27 | -36 | 288 |
| 33 | Total Earnings Per Share + | 2.35 | 3.63 | 4.47 | 2.09 | 0.55 | 2.72 | 2.89 | 2.73 | 4.45 | 5.04 | 3.31 | 0.23 | -0.31 | 2.49 |
| 34 | Total Earnings Per Share + | 2.34 | 3.61 | 4.44 | 2.08 | 0.55 | 2.70 | 2.86 | 2.70 | 4.17 | 4.45 | 3.07 | 0.23 | -0.31 | 2.45 |
| 35 | 0.68 | 0.68 | 0.68 | 0.59 | 0.53 | 0.52 | 0.51 | 0.25 | 0 | 0 | 0 | 0 | 0 | 0 |

 Click to Enlarge