| Date | Price $ | Result % | Candle Name | Side |
|---|---|---|---|---|
| 001 01 Apr 2024 | Sell Price: 63.29 | Profit: Open Day1 ($ 62.47) | Engulfing | Sell |
| 002 24 Jan 2024 | Sell Price: 70.46 | Loss: Close Day2 ($ 71.20) | Engulfing | Sell |
| 003 13 Dec 2023 | Buy Price: 68.09 | Profit: Open Day1 ($ 71.12) | Engulfing | Buy |
| 004 14 Nov 2023 | Buy Price: 56.69 | Profit: Close Day1 ($ 57.02) | Abandoned Baby | Buy |
| 005 24 Oct 2023 | Buy Price: 53.82 | Loss: Close Day2 ($ 53.58) | Abandoned Baby | Buy |
| 006 21 Sep 2023 | Sell Price: 60.88 | Profit: Close Day1 ($ 60.31) | Abandoned Baby | Sell |
| 007 18 Sep 2023 | Sell Price: 65.34 | Profit: Open Day1 ($ 65.26) | Abandoned Baby | Sell |
| 008 18 Sep 2023 | Sell Price: 65.28 | Profit: Open Day1 ($ 65.26) | Engulfing | Sell |
| 009 11 Sep 2023 | Sell Price: 66.16 | Profit: Open Day1 ($ 65.79) | Engulfing | Sell |
| 010 11 Sep 2023 | Sell Price: 66.04 | Profit: Open Day1 ($ 65.79) | Dark Cloud Cover | Sell |
| 011 26 Jul 2023 | Buy Price: 65.57 | Profit: Open Day1 ($ 65.97) | Engulfing | Buy |
| 012 22 Jun 2023 | Sell Price: 52.30 | Profit: Open Day1 ($ 51.93) | Engulfing | Sell |
| 013 15 Jun 2023 | Buy Price: 55.23 | Profit: Open Day1 ($ 55.35) | Piercing Line | Buy |
| 014 19 May 2023 | Sell Price: 49.08 | Loss: Close Day2 ($ 50.87) | Dark Cloud Cover | Sell |
| 015One Year Average | Both Sides Result for 14 Signals |
Profit: $ 3.59 ($ 0.26 / Signal) |
All of Them | Buy + Sell |
| Simple Moving Averages (SMA) Period | Value $ | Signal | Exponential Moving Averages (EMA) Period | Value $ | Signal | |
|---|---|---|---|---|---|---|
| 2 | 61.72 | SELL | 2 | 61.72 | SELL | |
| 3 | 62.13 | SELL | 3 | 61.79 | SELL | |
| 5 | 62.13 | SELL | 5 | 61.65 | SELL | |
| 8 | 60.94 | BUY | 8 | 61.42 | BUY | |
| 13 | 60.62 | BUY | 13 | 61.35 | BUY | |
| 21 | 61.56 | SELL | 21 | 61.61 | SELL | |
| 34 | 62.25 | SELL | 34 | 62.20 | SELL | |
| 55 | 63.23 | SELL | 55 | 62.90 | SELL | |
| 90 | 65.62 | SELL | 90 | 63.24 | SELL | |
| 200 | 63.01 | SELL | 200 | 63.47 | SELL |
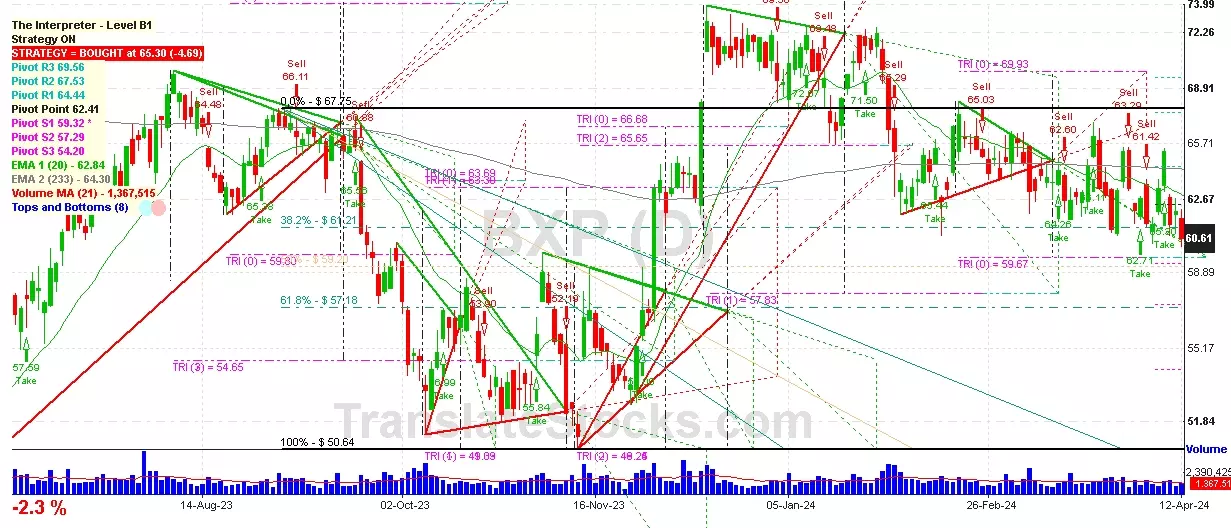
Boston Properties Inc
IPO: 1997-06-18
Ticker: BXPIndices: S&P 500,
Exchange: New York Stock Exchange, Inc. (US - USD)
Website: http://www.bostonproperties.com
Phone:
REIT (Real Estate Investment Trust)
Real Estate & Construction (
Real Estate Investment Trusts

 Click to Enlarge