logo
  • The Interpreter

    Hey Friend, I'm analysing CATERPILLAR INC (CAT), and it is between the Support of $ 365.52 (100% of Fibonacci) and the Resistance of $ 366.84 (PivotS1). The stock is falling and may come close and reach $ 365.52 soon.

Caterpillar Inc (CAT)

$ 343.38 +1.6%

Last Close 26-Apr-24

Next Support: $ 365.52


Pivot S2: $ 354.39
Fibonacci 100%: $ 365.52
Triangle Level (1): $ 359.28

Next Resistance: $ 366.84


Pivot S1: $ 366.84
Fibonacci 200%: $ 454.10


    Supports and Resistances
ImageClick to Enlarge
        

Date Price $ Result % Candle Name Side
001 01 Apr 2024 Sell Price: 363.74 Profit: Open Day1 ($ 362.31) Engulfing Sell
002 08 Mar 2024 Sell Price: 339.19 Profit: Open Day1 ($ 337.00) Dark Cloud Cover Sell
003 24 Nov 2023 Buy Price: 247.36 Profit: Close Day1 ($ 247.39) Abandoned Baby Buy
004 01 Nov 2023 Buy Price: 231.83 Profit: Open Day1 ($ 235.80) Engulfing Buy
005 11 Oct 2023 Sell Price: 272.83 Profit: Close Day1 ($ 269.61) Dark Cloud Cover Sell
006 10 Aug 2023 Sell Price: 283.82 Loss: Close Day2 ($ 284.56) Abandoned Baby Sell
007 07 Jul 2023 Buy Price: 245.18 Profit: Close Day1 ($ 248.81) Engulfing Buy
008 22 May 2023 Sell Price: 214.26 Profit: Open Day1 ($ 213.20) Abandoned Baby Sell
009One Year Average Both Sides Result for 8 Signals Profit: $ 14.79 ($ 1.85 / Signal)
+5.4% Gross in 1 Year
All of Them Buy + Sell

Trading Rules for Candlesticks Patterns.
  1. Buy or Sell on the same day of the signal, during the after-hours trading session.
  2. Watch the Opening and Closing of the next 2 days (4 in total).
  3. Immediately exit the Trade when one of them (Open or Close, Day 1 or 2) gives you a profit.
  4. The table above will show the first Profit opportunity, but not in real-time. Therefore, you must watch the market in real-time with your broker.
Remember: The returns an asset made in the past don't mean that future returns will be the same.

Find The Lastest Buy Signals for CAT Below.


Please Subscribe to See
The Latest Trade Signals


Bought Moving Averages

Sold Moving Averages

Simple Moving Averages (SMA) Period Value $ Signal   Exponential Moving Averages (EMA) Period Value $ Signal
2340.61 BUY   2344.27 SELL
3348.25 SELL   3346.63 SELL
5353.12 SELL   5350.11 SELL
8354.56 SELL   8353.47 SELL
13359.23 SELL   13356.54 SELL
21363.58 SELL   21357.45 SELL
34358.82 SELL   34354.01 SELL
55346.41 SELL   55344.82 SELL
90326.67 BUY   90329.98 BUY
200292.33 BUY   200299.50 BUY

Latest News +


Name & IPO

Caterpillar Inc
IPO: 1929-12-02

Stock Ticker & Exchange

Ticker: CATIndices: Dow 30, S&P 500,
Exchange: New York Stock Exchange, Inc. (US - USD)

Contact

Website: https://www.caterpillar.com/en.html
Phone:

Stock Type

Common Stock

SIC Office

Technology ()

Industry

Construction Machinery & Equip
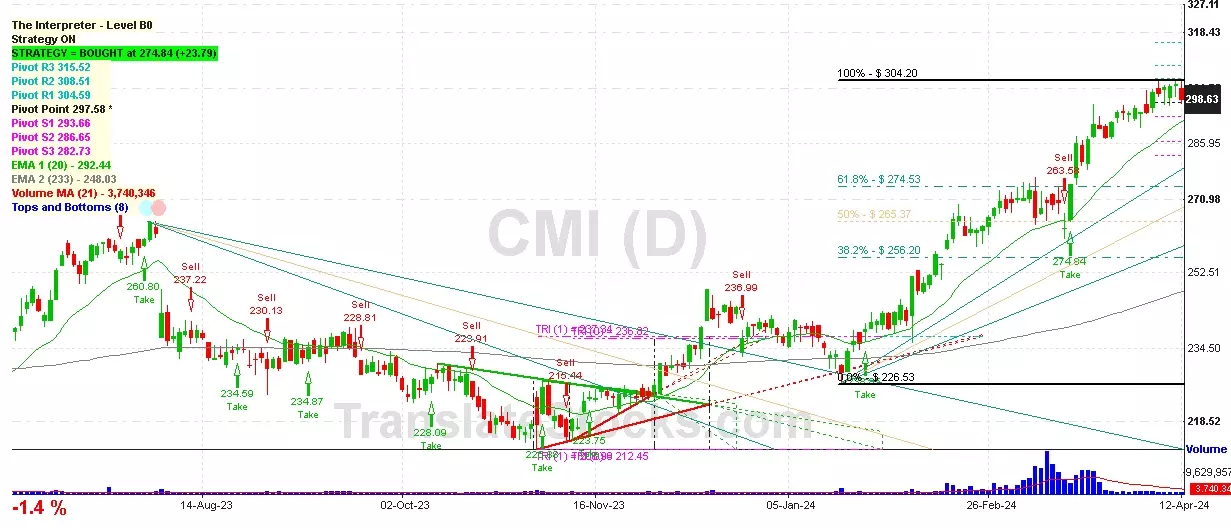
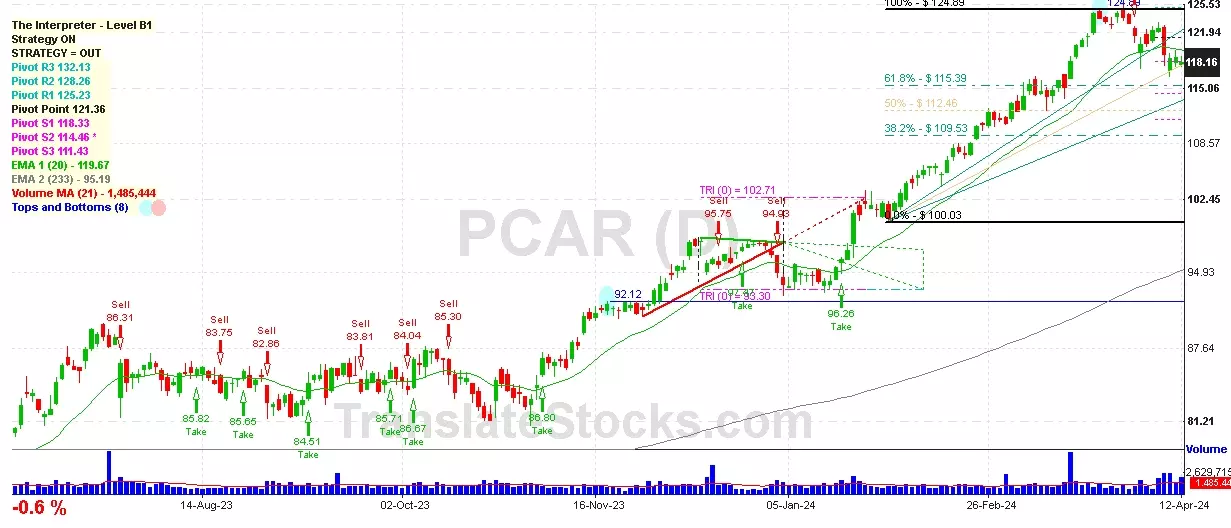
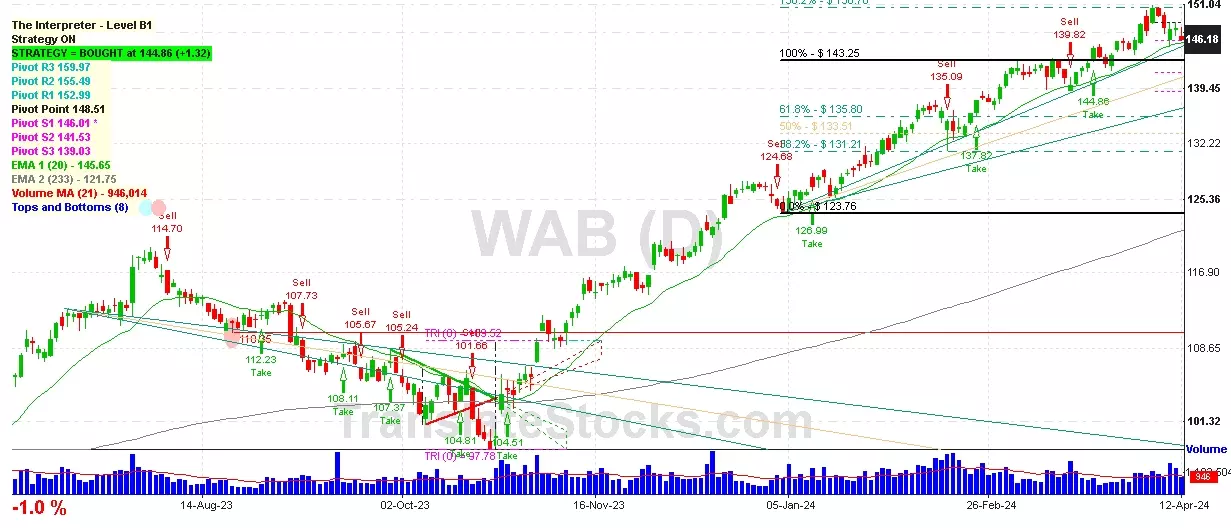
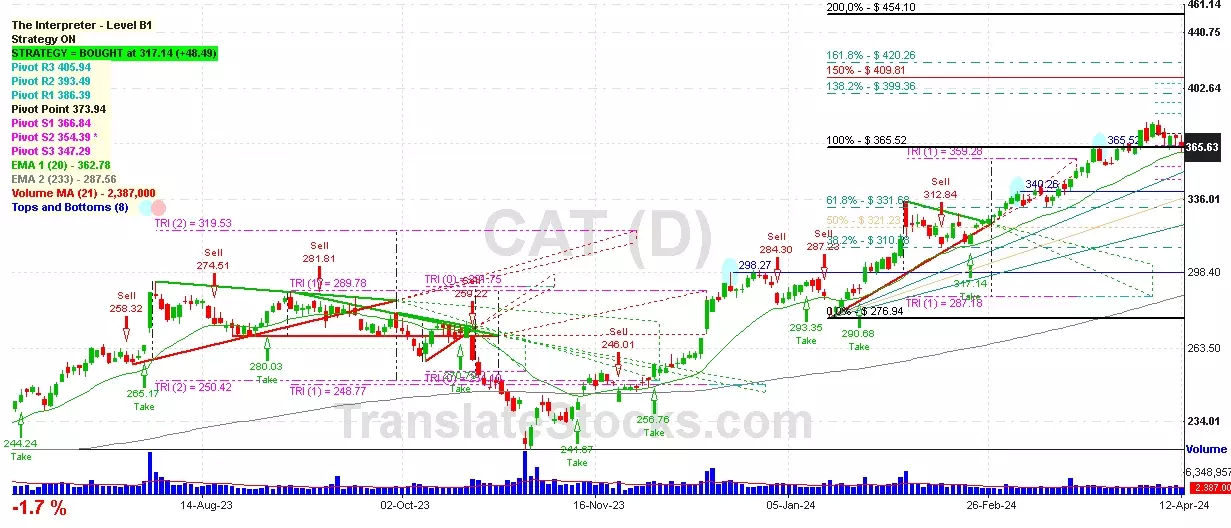
EIN

Fiscal Year End

State of Inc.


in USD millions (if not decimal) - Dictionary

in USD millions (if not decimal) - Dictionary

Statements sources
The financial statements are based on the company's filings with the The U.S. Securities and Exchange Commission (SEC) through the Electronic Data Gathering, Analysis, and Retrieval system (EDGAR). The information is derived from the 10-K and 10-Q reports submitted to the SEC in XBRL (eXtensible Business Reporting Language) format and presented according to the US GAAP Taxonomy. Please review the original filings for a more detailed information.

SEC Filings (click for details)   SEC Filings Web Page for Caterpillar Inc

Stock Peers for CAT

Settings
Color Scheme

Left Sidebar