
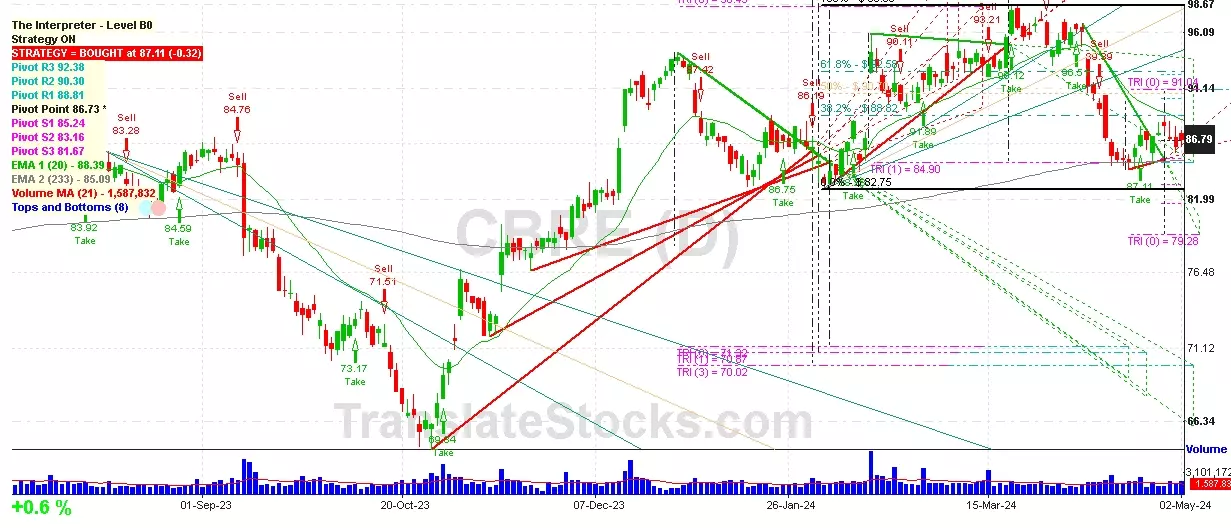
Hey Friend, I'm analysing CBRE GROUP INC A (CBRE), and it is between the Support of $ 86.73 (Pivot) and the Resistance of $ 88.81 (PivotR1). The stock is also approaching the line of Pivot at $ 86.73, and if it goes below this line it could reach the next Support of Triangle projection at $84.90.

| Date | Price $ | Result % | Candle Name | Side |
|---|---|---|---|---|
| 001 25 Apr 2024 | Buy Price: 87.02 | Profit: Open Day1 ($ 87.23) | Piercing Line | Buy |
| 002 24 Apr 2024 | Sell Price: 86.77 | Profit: Open Day1 ($ 85.78) | Dark Cloud Cover | Sell |
| 003 01 Apr 2024 | Sell Price: 94.98 | Profit: Open Day1 ($ 93.90) | Abandoned Baby | Sell |
| 004 22 Nov 2023 | Buy Price: 78.46 | Profit: Close Day1 ($ 79.01) | Abandoned Baby | Buy |
| 005 05 Oct 2023 | Buy Price: 72.24 | Profit: Close Day1 ($ 72.78) | Abandoned Baby | Buy |
| 006 05 Oct 2023 | Buy Price: 72.29 | Profit: Close Day1 ($ 72.78) | Engulfing | Buy |
| 007 12 Sep 2023 | Sell Price: 84.76 | Profit: Close Day1 ($ 79.07) | Abandoned Baby | Sell |
| 008 25 Aug 2023 | Sell Price: 82.58 | Loss: Close Day2 ($ 85.71) | Engulfing | Sell |
| 009 30 May 2023 | Sell Price: 75.05 | Profit: Open Day1 ($ 74.54) | Dark Cloud Cover | Sell |
| 010One Year Average | Both Sides Result for 9 Signals |
Profit: $ 6.93 ($ 0.77 / Signal) |
All of Them | Buy + Sell |
| Simple Moving Averages (SMA) Period | Value $ | Signal | Exponential Moving Averages (EMA) Period | Value $ | Signal | |
|---|---|---|---|---|---|---|
| 2 | 86.68 | SELL | 2 | 86.62 | SELL | |
| 3 | 86.54 | BUY | 3 | 86.66 | SELL | |
| 5 | 86.89 | SELL | 5 | 86.74 | SELL | |
| 8 | 86.95 | SELL | 8 | 86.87 | SELL | |
| 13 | 86.45 | BUY | 13 | 87.36 | SELL | |
| 21 | 88.41 | SELL | 21 | 88.33 | SELL | |
| 34 | 91.16 | SELL | 34 | 89.32 | SELL | |
| 55 | 91.60 | SELL | 55 | 89.58 | SELL | |
| 90 | 89.86 | SELL | 90 | 88.67 | SELL | |
| 200 | 84.07 | BUY | 200 | 85.55 | BUY |
Cbre Group Inc - A
IPO: 2004-06-10
Ticker: CBREIndices: S&P 500,
Exchange: New York Stock Exchange, Inc. (US - USD)
Website: https://www.cbre.us
Phone:
Common Stock
Real Estate & Construction (
Real Estate
 Click to Enlarge