| Date | Price $ | Result % | Candle Name | Side |
|---|---|---|---|---|
| 001 02 Jan 2024 | Buy Price: 391.51 | Profit: Open Day1 ($ 391.66) | Engulfing | Buy |
| 002 26 Dec 2023 | Buy Price: 389.50 | Profit: Close Day1 ($ 391.54) | Engulfing | Buy |
| 003 20 Dec 2023 | Sell Price: 381.22 | Loss: Close Day2 ($ 382.09) | Engulfing | Sell |
| 004 30 Oct 2023 | Buy Price: 389.80 | Profit: Open Day1 ($ 391.28) | Engulfing | Buy |
| 005 19 Sep 2023 | Sell Price: 449.68 | Profit: Close Day1 ($ 448.17) | Abandoned Baby | Sell |
| 006 04 Aug 2023 | Sell Price: 418.86 | Profit: Open Day2 ($ 417.82) | Engulfing | Sell |
| 007 06 Jun 2023 | Sell Price: 329.00 | Loss: Close Day2 ($ 336.18) | Engulfing | Sell |
| 008 31 May 2023 | Sell Price: 326.15 | Loss: Close Day2 ($ 329.32) | Engulfing | Sell |
| 009One Year Average | Both Sides Result for 8 Signals |
Loss: $ -5.00 ($ -0.62 / Signal) |
All of Them | Buy + Sell |
| Simple Moving Averages (SMA) Period | Value $ | Signal | Exponential Moving Averages (EMA) Period | Value $ | Signal | |
|---|---|---|---|---|---|---|
| 2 | 256.86 | SELL | 2 | 256.77 | SELL | |
| 3 | 259.47 | SELL | 3 | 258.29 | SELL | |
| 5 | 261.96 | SELL | 5 | 259.89 | SELL | |
| 8 | 261.62 | SELL | 8 | 261.21 | SELL | |
| 13 | 261.33 | SELL | 13 | 263.52 | SELL | |
| 21 | 267.10 | SELL | 21 | 267.80 | SELL | |
| 34 | 277.51 | SELL | 34 | 275.36 | SELL | |
| 55 | 282.05 | SELL | 55 | 288.69 | SELL | |
| 90 | 315.62 | SELL | 90 | 308.87 | SELL | |
| 200 | 370.98 | SELL | 200 | 343.89 | SELL |
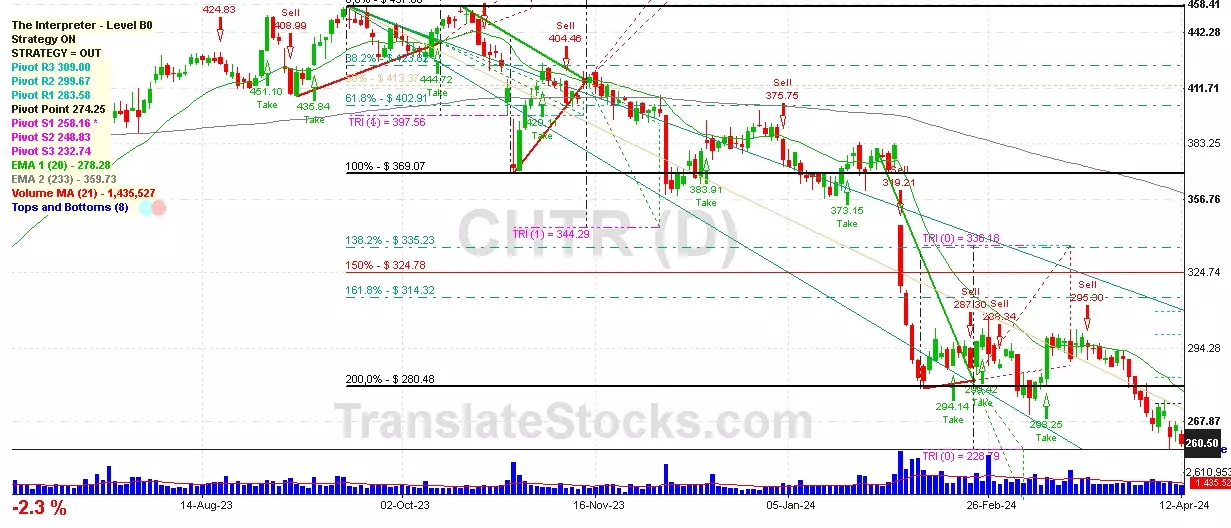
Charter Communications Inc-a
IPO: 2009-12-02
Ticker: CHTRIndices: S&P 500,
Nasdaq 100,
Exchange: Nasdaq Nms - Global Market (US - USD)
Website: https://www.charter.com/
Phone:
Common Stock
Technology (
Cable & Other Pay Television Services

 Click to Enlarge