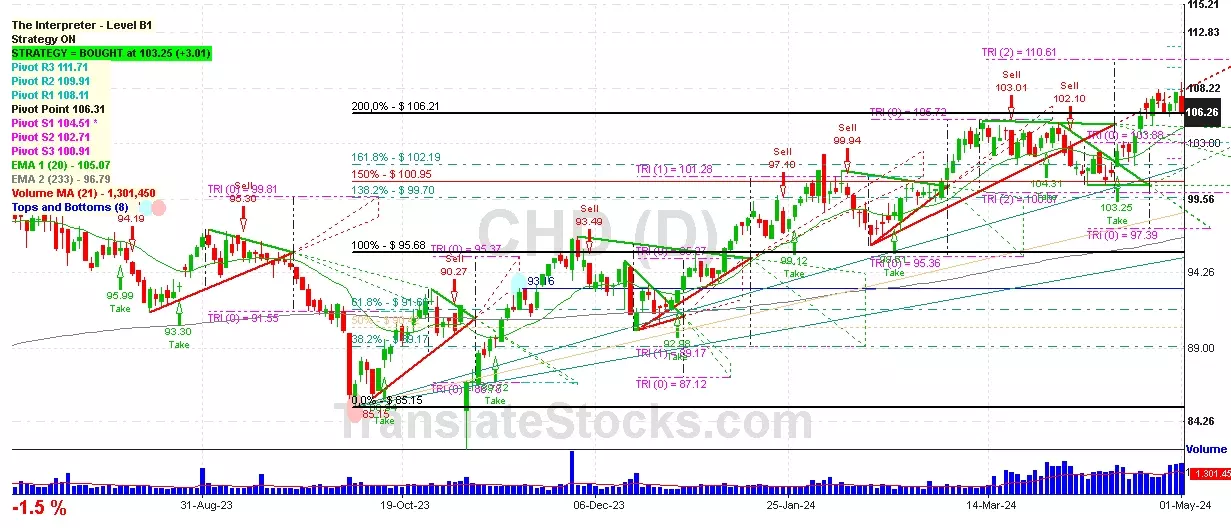
| Date | Price $ | Result % | Candle Name | Side |
|---|---|---|---|---|
| 001 01 Apr 2024 | Sell Price: 151.65 | Profit: Open Day1 ($ 150.00) | Abandoned Baby | Sell |
| 002 26 Feb 2024 | Sell Price: 151.29 | Profit: Open Day1 ($ 150.34) | Abandoned Baby | Sell |
| 003 26 Feb 2024 | Sell Price: 151.01 | Profit: Open Day1 ($ 150.34) | Engulfing | Sell |
| 004 23 Feb 2024 | Buy Price: 152.84 | Profit: Open Day1 ($ 153.00) | Abandoned Baby | Buy |
| 005 22 Feb 2024 | Sell Price: 152.60 | Profit: Close Day2 ($ 151.00) | Abandoned Baby | Sell |
| 006 31 Jan 2024 | Sell Price: 145.25 | Profit: Open Day1 ($ 145.17) | Dark Cloud Cover | Sell |
| 007 28 Dec 2023 | Buy Price: 142.06 | Profit: Open Day1 ($ 142.25) | Engulfing | Buy |
| 008 29 Jun 2023 | Buy Price: 158.08 | Profit: Open Day1 ($ 158.27) | Engulfing | Buy |
| 009 29 Jun 2023 | Buy Price: 157.91 | Profit: Open Day1 ($ 158.27) | Piercing Line | Buy |
| 010One Year Average | Both Sides Result for 9 Signals |
Profit: $ 5.85 ($ 0.65 / Signal) |
All of Them | Buy + Sell |
| Simple Moving Averages (SMA) Period | Value $ | Signal | Exponential Moving Averages (EMA) Period | Value $ | Signal | |
|---|---|---|---|---|---|---|
| 2 | 143.76 | SELL | 2 | 142.39 | SELL | |
| 3 | 145.48 | SELL | 3 | 143.71 | SELL | |
| 5 | 146.08 | SELL | 5 | 144.79 | SELL | |
| 8 | 146.16 | SELL | 8 | 145.18 | SELL | |
| 13 | 144.72 | SELL | 13 | 145.37 | SELL | |
| 21 | 144.77 | SELL | 21 | 145.87 | SELL | |
| 34 | 147.06 | SELL | 34 | 146.69 | SELL | |
| 55 | 149.30 | SELL | 55 | 147.12 | SELL | |
| 90 | 147.75 | SELL | 90 | 146.73 | SELL | |
| 200 | 144.26 | SELL | 200 | 146.47 | SELL |
Clorox Company
IPO: 1968-08-01
Ticker: CLXIndices: S&P 500,
Exchange: New York Stock Exchange, Inc. (US - USD)
Website: https://www.thecloroxcompany.com/
Phone:
Common Stock
Life Sciences (
Specialty Cleaning, Polishing And Sanitation Preparations

 Click to Enlarge