| Date | Price $ | Result % | Candle Name | Side |
|---|---|---|---|---|
| 001 28 Mar 2024 | Sell Price: 101.46 | Profit: Open Day1 ($ 101.04) | Engulfing | Sell |
| 002 20 Mar 2024 | Sell Price: 101.66 | Profit: Open Day1 ($ 101.48) | Engulfing | Sell |
| 003 12 Mar 2024 | Buy Price: 101.54 | Profit: Open Day1 ($ 103.50) | Engulfing | Buy |
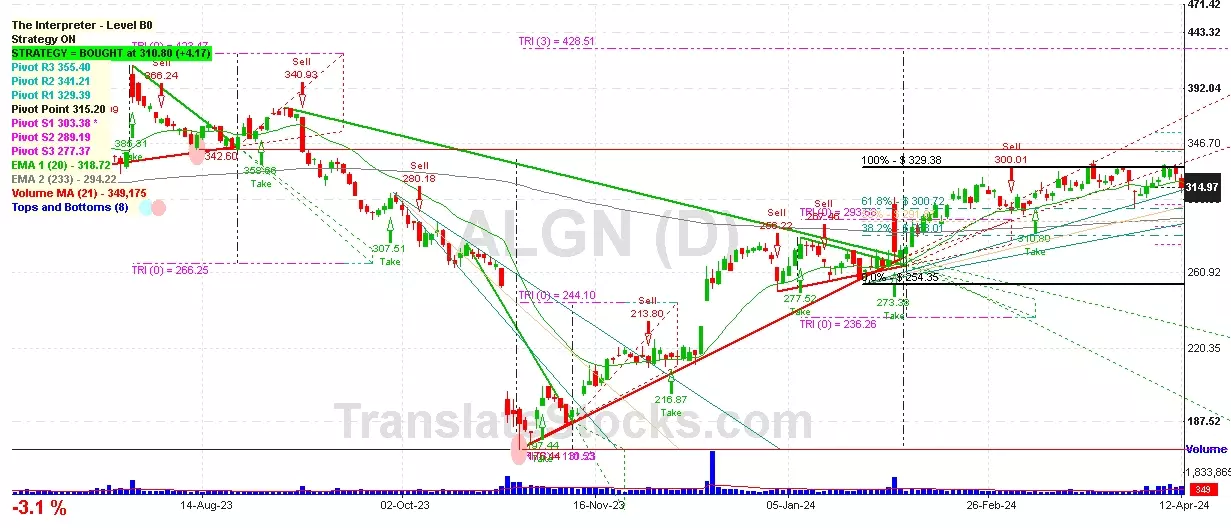
| 004 06 Oct 2023 | Buy Price: 313.63 | Profit: Close Day2 ($ 316.12) | Engulfing | Buy |
| 005 06 Oct 2023 | Buy Price: 313.46 | Profit: Close Day2 ($ 316.12) | Piercing Line | Buy |
| 006 14 Aug 2023 | Buy Price: 378.63 | Loss: Close Day2 ($ 372.77) | Abandoned Baby | Buy |
| 007 14 Aug 2023 | Buy Price: 377.92 | Loss: Close Day2 ($ 372.77) | Engulfing | Buy |
| 008 08 Aug 2023 | Sell Price: 385.06 | Profit: Open Day1 ($ 384.91) | Abandoned Baby | Sell |
| 009 03 Aug 2023 | Buy Price: 389.82 | Profit: Open Day2 ($ 390.85) | Engulfing | Buy |
| 010 31 Jul 2023 | Sell Price: 391.26 | Profit: Open Day1 ($ 387.76) | Engulfing | Sell |
| 011 20 Jul 2023 | Sell Price: 391.85 | Profit: Close Day1 ($ 387.61) | Engulfing | Sell |
| 012 03 Jul 2023 | Sell Price: 377.42 | Profit: Close Day1 ($ 377.30) | Abandoned Baby | Sell |
| 013 19 May 2023 | Sell Price: 386.10 | Profit: Close Day2 ($ 379.86) | Engulfing | Sell |
| 014One Year Average | Both Sides Result for 13 Signals |
Profit: $ 11.98 ($ 0.92 / Signal) |
All of Them | Buy + Sell |
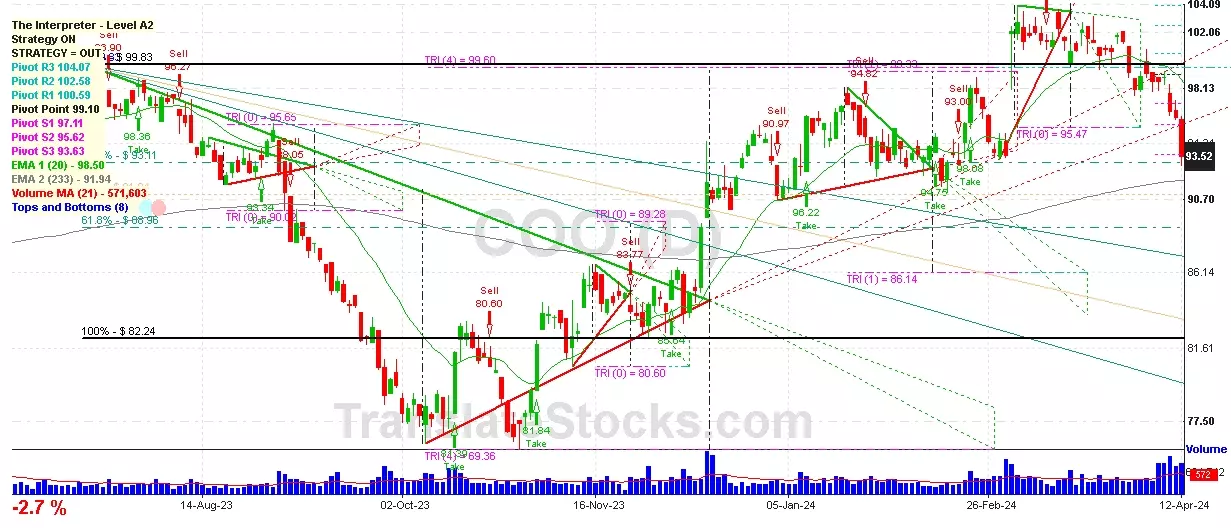
| Simple Moving Averages (SMA) Period | Value $ | Signal | Exponential Moving Averages (EMA) Period | Value $ | Signal | |
|---|---|---|---|---|---|---|
| 2 | 89.39 | SELL | 2 | 89.27 | SELL | |
| 3 | 89.66 | SELL | 3 | 89.55 | SELL | |
| 5 | 90.14 | SELL | 5 | 89.95 | SELL | |
| 8 | 90.17 | SELL | 8 | 90.61 | SELL | |
| 13 | 91.55 | SELL | 13 | 92.01 | SELL | |
| 21 | 94.43 | SELL | 21 | 96.35 | SELL | |
| 34 | 97.08 | SELL | 34 | 111.41 | SELL | |
| 55 | 96.93 | SELL | 55 | 143.39 | SELL | |
| 90 | 95.78 | SELL | 90 | 188.06 | SELL | |
| 200 | 91.04 | SELL | 200 | 257.74 | SELL |
Cooper Cos Inc/the
IPO: 1983-12-06
Ticker: COOIndices: S&P 500,
Exchange: New York Stock Exchange, Inc. (US - USD)
Website: https://www.coopercos.com/
Phone:
Common Stock
Life Sciences (
Ophthalmic Goods
Year | 2021 | 2020 | 2019 | 2018 | 2017 | 2016 | 2015 | 2014 | 2013 | 2012 | 2011 | 2010 | 2009 | 2008 | 2007 | |
|---|---|---|---|---|---|---|---|---|---|---|---|---|---|---|---|---|
| 1 | Assets + | 9,606 | 6,738 | 6,274 | 6,113 | 4,859 | 4,476 | 4,461 | 4,458 | 3,137 | 2,941 | 2,625 | 2,525 | 2,552 | 2 | 3 |
| 2 | Real Estate Investment Property + | 0 | 0 | 0 | 0 | 0 | 0 | 0 | 0 | 0 | 0 | 7 | 7 | 0 | 0 | 0 |
| 3 | Real Estate Investment Property + | 0 | 0 | 0 | 0 | 0 | 0 | 0 | 0 | 0 | 0 | 7 | 7 | 0 | 0 | 0 |
| 4 | Cash and Cash Equivalents + | 96 | 116 | 89 | 78 | 89 | 101 | 16 | 25 | 77 | 13 | 5 | 4 | 4 | 2 | 3 |
| 5 | Property + | 1,348 | 1,282 | 1,132 | 976 | 910 | 878 | 967 | 937 | 740 | 640 | 609 | 594 | 603 | 0 | 0 |
| 6 | Property + | 2,656 | 2,475 | 2,194 | 1,930 | 1,758 | 1,603 | 1,651 | 1,526 | 1,241 | 1,060 | 956 | 919 | 882 | 0 | 0 |
| 7 | Intangible Assets + | 1,272 | 1,289 | 1,405 | 1,521 | 505 | 441 | 411 | 454 | 199 | 215 | 128 | 114 | 115 | 0 | 0 |
| 8 | Finite-Lived Intangible Assets + | 1,261 | 1,279 | 1,396 | 1,512 | 505 | 441 | 411 | 454 | 199 | 215 | 128 | 114 | 0 | 0 | 0 |
| 9 | Liabilities and Equity + | 9,606 | 6,738 | 6,274 | 6,113 | 4,859 | 4,476 | 4,461 | 4,458 | 3,137 | 2,941 | 2,625 | 2,525 | 2,552 | 1,417 | 1,461 |
| 10 | Liabilities + | 2,664 | 2,913 | 2,646 | 2,805 | 1,683 | 1,776 | 1,787 | 1,870 | 714 | 728 | 687 | 858 | 1,012 | 0 | 0 |
| 11 | Debt and Lease Obligation + | 0 | 0 | 0 | 37 | 23 | 226 | 244 | 102 | 43 | 25 | 53 | 19 | 7 | 0 | 0 |
| 12 | Stockholders' Equity + | 6,942 | 3,825 | 3,629 | 3,308 | 3,176 | 2,700 | 2,674 | 2,588 | 2,423 | 2,213 | 1,937 | 1,667 | 1,540 | 1,417 | 1,461 |
| 13 | Stockholders' Equity Attributable to Parent + | 6,942 | 3,825 | 3,628 | 3,308 | 3,176 | 2,700 | 2,668 | 2,570 | 2,405 | 2,193 | 1,937 | 1,667 | 1,540 | 1,417 | 1,461 |
| 14 | Stockholders' Equity + | 0.20 | 0.20 | 0.20 | 0.20 | 0.20 | 0.20 | 0.20 | 0.20 | 0.20 | 0.20 | 0.20 | 0.20 | 0.20 | 0 | 0 |
| 15 | Preferred Stock + | 0.10 | 0.10 | 0.10 | 0.10 | 0.10 | 0.10 | 0.10 | 0.10 | 0.10 | 0.10 | 0.10 | 0.10 | 0.10 | 0 | 0 |
| 16 | Common Stock + | 0.10 | 0.10 | 0.10 | 0.10 | 0.10 | 0.10 | 0.10 | 0.10 | 0.10 | 0.10 | 0.10 | 0.10 | 0.10 | 0 | 0 |
| 17 | Partners' Capital + | 6,202 | 3,262 | 3,026 | 2,576 | 2,434 | 2,050 | 1,779 | 1,579 | 1,312 | 1,019 | 773 | 601 | 490 | -25 | 0 |
| 18 | Partners' Capital + | 6,202 | 3,262 | 3,026 | 2,576 | 2,434 | 2,050 | 1,779 | 1,579 | 1,312 | 1,019 | 773 | 601 | 490 | -25 | 0 |
| 19 | Limited Liability Company (LLC) Members' Equity + | 5,861 | 2,790 | 2,579 | 2,145 | 2,059 | 1,560 | 1,587 | 1,473 | 1,296 | 988 | 755 | 584 | 477 | -25 | 0 |
| 20 | Limited Liability Company (LLC) Members' Equity + | 5,861 | 2,790 | 2,579 | 2,145 | 2,059 | 1,560 | 1,587 | 1,473 | 1,296 | 988 | 755 | 584 | 477 | -25 | 0 |
| 21 | Current Assets + | 1,465 | 1,274 | 1,163 | 1,091 | 953 | 934 | 842 | 792 | 747 | 658 | 540 | 491 | 504 | 0 | 0 |
| 22 | Cash + | 0 | 1 | 0 | 2 | 0 | 0 | 0 | 0 | 0 | 0 | 0 | 0 | 0 | 0 | 0 |
| 23 | Current Other Undisclosed Receivables | 0 | 0 | 221 | 0 | 182 | 225 | 139 | 135 | 178 | 104 | 71 | 66 | 72 | 0 | 0 |
| 24 | Current Receivables + | 515 | 435 | 656 | 375 | 499 | 516 | 422 | 411 | 408 | 338 | 286 | 263 | 243 | 0 | 0 |
| 25 | Inventory + | 586 | 570 | 507 | 469 | 454 | 418 | 420 | 381 | 339 | 320 | 254 | 228 | 261 | 0 | 0 |
| 26 | Current Disposal Group + | 89 | 0 | 0 | 0 | 0 | 0 | 0 | 0 | 0 | 0 | 0 | 0 | 0 | 0 | 0 |
| 27 | Long-Term Assets + | 5,522 | 2,892 | 2,574 | 2,524 | 2,431 | 2,217 | 2,236 | 2,260 | 1,435 | 1,414 | 1,325 | 1,303 | 1,303 | 0 | 0 |
| 28 | Current Liabilities + | 732 | 1,004 | 1,111 | 536 | 396 | 536 | 569 | 442 | 321 | 263 | 267 | 200 | 175 | 0 | 0 |
| 29 | Long-Term Other Undisclosed Liabilities | 140 | 100 | 119 | 0 | 0 | 0 | 0 | 0 | 0 | 0 | 0 | 0 | 0 | 0 | 0 |
| 30 | Long-Term Liabilities + | 1,932 | 1,909 | 1,535 | 2,159 | 1,188 | 1,157 | 1,144 | 1,310 | 327 | 389 | 353 | 613 | 793 | 0 | 0 |
| 31 | Increase (Decrease) in Stockholders' Equity [Roll Forward] + | -640 | -617 | -571 | -415 | -415 | -360 | -360 | -295 | -226 | -65 | -3 | -5 | -5 | 0 | 0 |
| 32 | Treasury Stock Transactions + | -640 | -617 | -571 | -415 | -415 | -360 | -360 | -295 | -226 | -65 | -3 | -5 | -5 | 0 | 0 |
| 33 | Treasury Stock + | -640 | -617 | -571 | -415 | -415 | -360 | -360 | -295 | -226 | -65 | -3 | -5 | -5 | 0 | 0 |
| 34 | Total Current Assets + | 1,465 | 1,274 | 1,163 | 1,091 | 953 | 934 | 842 | 792 | 747 | 658 | 540 | 491 | 504 | 0 | 0 |
| 35 | Operating Lease + | 257 | 260 | 0 | 0 | 0 | 0 | 0 | 0 | 0 | 0 | 0 | 0 | 0 | 0 | 0 |
| 36 | Goodwill + | 2,574 | 2,447 | 2,429 | 2,392 | 2,355 | 2,165 | 2,197 | 2,221 | 1,388 | 1,370 | 1,277 | 1,262 | 1,257 | 0 | 0 |
| 37 | Long-Term Other Assets + | 144 | 105 | 67 | 74 | 76 | 52 | 39 | 39 | 47 | 44 | 48 | 41 | 46 | 0 | 0 |
| 38 | Long-Term Regulated Entity + | 0 | 0 | 0 | 0 | 0 | 0 | 0 | 0 | 0 | 6 | 0 | 0 | 0 | 0 | 0 |
| 39 | Deferred Income Tax Assets + | 2,691 | 185 | 145 | 132 | 0 | 0 | 0 | 0 | 0 | 0 | 0 | 0 | 0 | 0 | 0 |
| 40 | Total Assets + | 9,606 | 6,738 | 6,274 | 6,113 | 4,859 | 4,476 | 4,461 | 4,458 | 3,137 | 2,941 | 2,625 | 2,525 | 2,552 | 0 | 0 |
| 41 | Total Liabilities + | 2,664 | 2,913 | 2,646 | 2,805 | 1,683 | 1,776 | 1,787 | 1,870 | 714 | 728 | 687 | 858 | 1,012 | 0 | 0 |
| 42 | Stockholders' Equity Attributable to Noncontrolling Interest + | 0 | 0 | 0 | 0 | 0 | 0 | 6 | 19 | 19 | 20 | 0 | 0 | 0 | 0 | 0 |
| 43 | Total Stockholders' Equity + | 6,942 | 3,825 | 3,629 | 3,308 | 3,176 | 2,700 | 2,674 | 2,588 | 2,423 | 2,213 | 1,937 | 1,667 | 1,540 | 0 | 0 |
| 44 | Total Liabilities and Equity + | 9,606 | 6,738 | 6,274 | 6,113 | 4,859 | 4,476 | 4,461 | 4,458 | 3,137 | 2,941 | 2,625 | 2,525 | 2,552 | 0 | 0 |
Year | 2021 | 2020 | 2019 | 2018 | 2017 | 2016 | 2015 | 2014 | 2013 | 2012 | 2011 | 2010 | 2009 | 2008 | |
|---|---|---|---|---|---|---|---|---|---|---|---|---|---|---|---|
| 1 | 0 | 0 | 0 | 2,533 | 2,139 | 1,967 | 0 | 0 | 0 | 0 | 0 | 0 | 0 | 0 | |
| 2 | -967 | -896 | -897 | -900 | -773 | -794 | -727 | -626 | -561 | -521 | -526 | -482 | -484 | -437 | |
| 3 | 1,956 | 1,535 | 1,757 | 1,632 | 1,366 | 1,173 | 1,070 | 1,092 | 1,027 | 924 | 805 | 677 | 596 | 610 | |
| 4 | 0 | 0 | 0 | 0 | 0 | 0 | 0 | 0 | 0 | 0 | 0 | 0 | 3 | 0 | |
| 5 | 93 | 93 | 87 | 85 | 69 | 65 | 70 | 66 | 59 | 52 | 44 | 35 | 33 | 35 | |
| 6 | 309 | 287 | 281 | 275 | 0 | 0 | 0 | 0 | 0 | 0 | 0 | 0 | 0 | 0 | |
| 7 | 1,211 | 992 | 996 | 973 | 799 | 723 | 713 | 683 | 611 | 565 | 513 | 433 | 392 | 429 | |
| 8 | -2 | -6 | -3 | 8 | 2 | 3 | 0 | 1 | 1 | 0 | 1 | -1 | 1 | 0 | |
| 9 | 0 | 0 | -8 | -5 | -6 | -31 | -42 | -10 | -7 | -4 | -12 | -8 | -11 | -11 | |
| 10 | 0 | 0 | 19 | 0 | 0 | 0 | 0 | 0 | 0 | 0 | 0 | 0 | 0 | 0 | |
| 11 | 0 | 0 | 0 | 0 | 0 | 0 | 0 | 0 | -21 | 0 | 0 | 0 | 0 | 0 | |
| 12 | 506 | 312 | 547 | 403 | 429 | 324 | 237 | 306 | 306 | 283 | 228 | 190 | 150 | 127 | |
| 13 | -6 | -1 | -2 | -3 | -1 | -2 | -4 | -3 | 0 | -2 | -1 | -1 | 7 | 0 | |
| 14 | 9 | -8 | -1 | 12 | -2 | 0 | 0 | 0 | 0 | 0 | 0 | 0 | 0 | 0 | |
| 15 | 9 | -8 | -1 | 12 | -2 | -2 | -3 | -2 | 1 | 0 | -1 | -1 | 9 | 0 | |
| 16 | 23 | 37 | 68 | 83 | 33 | 26 | 18 | 8 | 9 | 12 | 17 | 37 | 44 | 53 | |
| 17 | 0 | 0 | 0 | 0 | 0 | 0 | 0 | 0 | 0 | 0 | -16 | 0 | 0 | 0 | |
| 18 | 0 | 0 | 0 | 0 | 0 | 0 | 0 | 0 | 0 | -1 | -32 | 0 | -2 | 3 | |
| 19 | 0 | 0 | 0 | 0 | 0 | 0 | 0 | 0 | 0 | 1 | 16 | 0 | -2 | 0 | |
| 20 | 0 | 266 | 477 | 332 | 394 | 296 | 215 | 297 | 312 | 275 | 193 | 124 | 115 | 74 | |
| 21 | 492 | 94 | 128 | 113 | 0 | 0 | 0 | 0 | 0 | 0 | 0 | 0 | 0 | 0 | |
| 22 | 2,453 | -28 | -11 | -192 | -21 | -21 | -10 | -25 | -15 | -27 | -17 | -12 | -14 | -10 | |
| 23 | 2,945 | 238 | 467 | 140 | 373 | 275 | 205 | 272 | 297 | 249 | 175 | 113 | 0 | 0 | |
| 24 | 0 | 0 | 0 | 0 | 0 | -1 | -2 | -2 | -1 | 0 | 0 | 0 | 0 | 0 | |
| 25 | Total Net Income (Loss) Attributable to Parent + | 2,945 | 238 | 467 | 140 | 373 | 274 | 204 | 270 | 296 | 248 | 175 | 113 | 101 | 64 |
| 26 | 2,945 | 238 | 467 | 0 | 0 | 0 | 0 | 0 | 0 | 0 | 0 | 0 | 0 | 0 | |
| 27 | Total Earnings Per Share + | 59.80 | 4.85 | 9.44 | 2.85 | 7.63 | 5.65 | 4.20 | 5.61 | 6.09 | 5.18 | 3.74 | 2.48 | 2.23 | 1.42 |
| 28 | Total Earnings Per Share + | 59.16 | 4.81 | 9.33 | 2.81 | 7.52 | 5.59 | 4.14 | 5.51 | 5.96 | 5.05 | 3.63 | 2.43 | 2.21 | 1.42 |
| 29 | 0.03 | 0.03 | 0.03 | 0.03 | 0.03 | 0.03 | 0.03 | 0.03 | 0.03 | 0.03 | 0 | 0 | 0 | 0 |

 Click to Enlarge