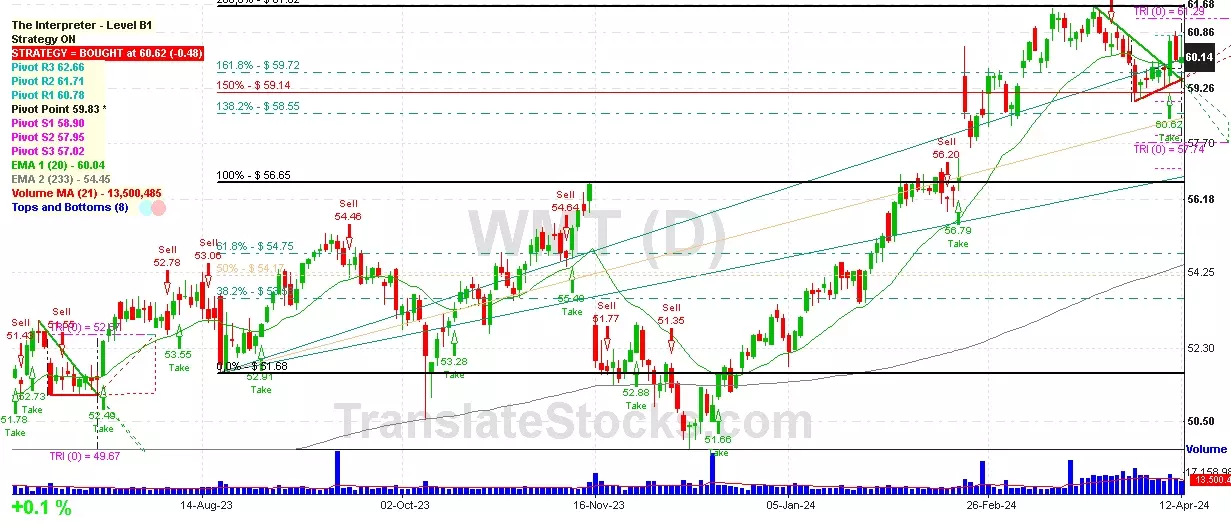
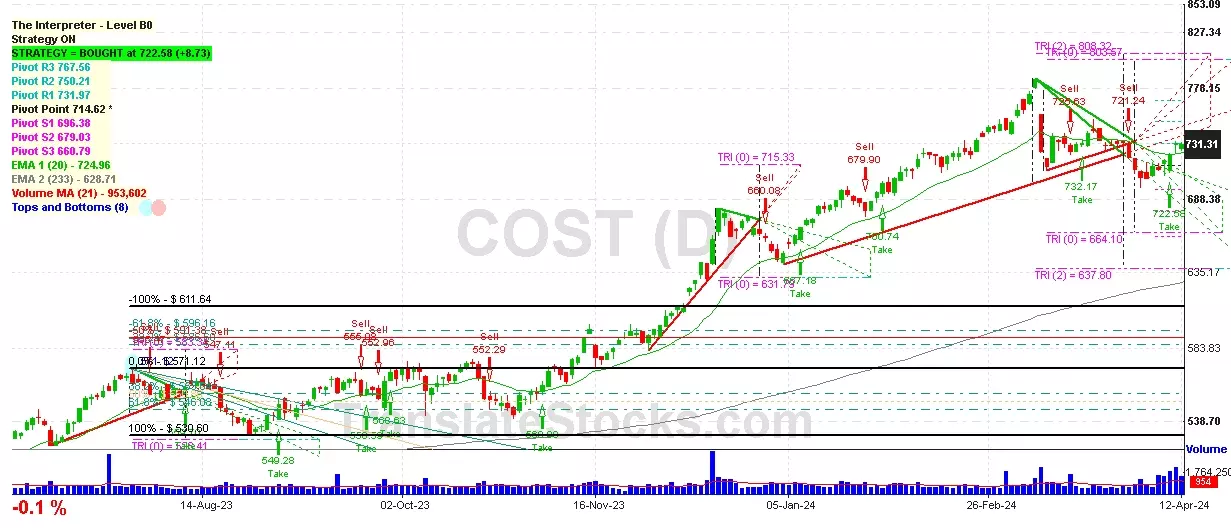
Hey Friend, I'm analysing COSTCO WHOLESALE CORP (COST), and it is between the Support of $ 715.33 (Triangle Projection Level 0) and the Resistance of $ 731.97 (PivotR1). The stock is also approaching the line of PivotR1 at $ 731.97, and if it goes above this line it could reach the next Resistance of Triangle projection at $803.57.

| Date | Price $ | Result % | Candle Name | Side |
|---|---|---|---|---|
| 001 09 Feb 2024 | Sell Price: 723.40 | Profit: Close Day1 ($ 722.41) | Engulfing | Sell |
| 002 27 Dec 2023 | Sell Price: 666.80 | Profit: Open Day1 ($ 665.85) | Abandoned Baby | Sell |
| 003 01 Sep 2023 | Sell Price: 544.25 | Profit: Open Day2 ($ 541.72) | Dark Cloud Cover | Sell |
| 004 22 Jun 2023 | Buy Price: 524.20 | Profit: Close Day1 ($ 524.44) | Abandoned Baby | Buy |
| 005 16 Jun 2023 | Sell Price: 523.48 | Profit: Open Day1 ($ 521.95) | Abandoned Baby | Sell |
| 006 16 Jun 2023 | Sell Price: 523.65 | Profit: Open Day1 ($ 521.95) | Engulfing | Sell |
| 007 25 May 2023 | Buy Price: 486.46 | Profit: Close Day1 ($ 507.26) | Engulfing | Buy |
| 008 25 May 2023 | Buy Price: 486.55 | Profit: Close Day1 ($ 507.26) | Piercing Line | Buy |
| 009One Year Average | Both Sides Result for 8 Signals |
Profit: $ 49.45 ($ 6.18 / Signal) |
All of Them | Buy + Sell |
| Simple Moving Averages (SMA) Period | Value $ | Signal | Exponential Moving Averages (EMA) Period | Value $ | Signal | |
|---|---|---|---|---|---|---|
| 2 | 725.52 | BUY | 2 | 726.81 | BUY | |
| 3 | 724.98 | BUY | 3 | 725.31 | BUY | |
| 5 | 722.61 | BUY | 5 | 723.23 | BUY | |
| 8 | 718.63 | BUY | 8 | 721.63 | BUY | |
| 13 | 720.73 | BUY | 13 | 720.94 | BUY | |
| 21 | 718.54 | BUY | 21 | 721.65 | BUY | |
| 34 | 723.76 | BUY | 34 | 721.99 | BUY | |
| 55 | 729.43 | SELL | 55 | 716.62 | BUY | |
| 90 | 710.28 | BUY | 90 | 699.50 | BUY | |
| 200 | 631.39 | BUY | 200 | 647.65 | BUY |
Costco Wholesale Corp
IPO: 1985-12-05
Ticker: COSTIndices: S&P 500,
Nasdaq 100,
Exchange: Nasdaq Nms - Global Market (US - USD)
Website: https://www.costco.com/
Phone:
Common Stock
Trade & Services (
Retail-variety Stores
 Click to Enlarge