
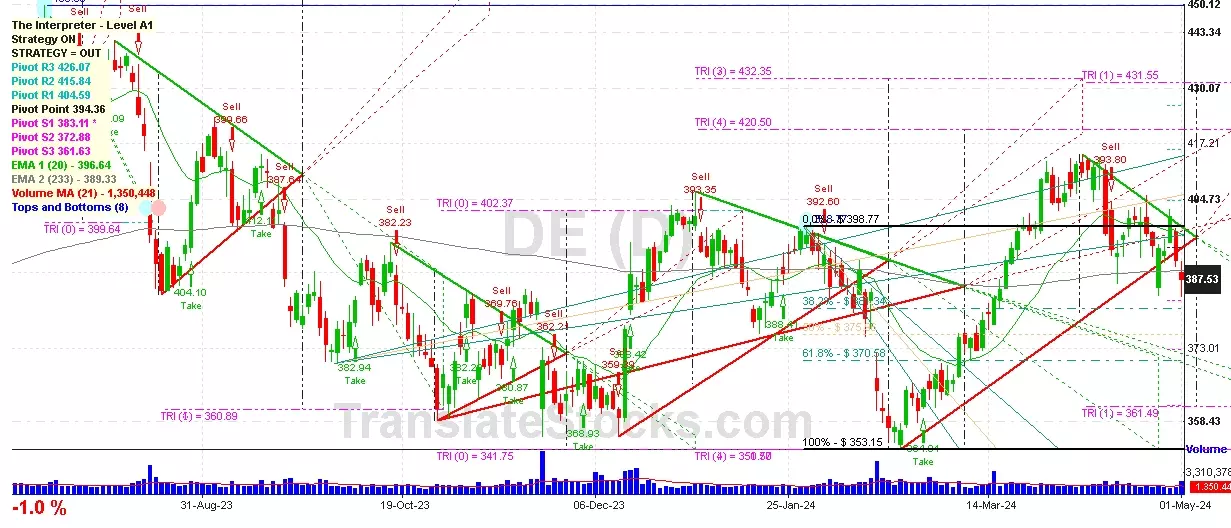
Hey Friend, I'm analysing DEERE & CO (DE), and it is between the Support of $ 383.11 (PivotS1) and the Resistance of $ 394.36 (Pivot). The stock is also approaching the line of PivotS1 at $ 383.11, and if it goes below this line it could reach the next Support of 38.2% of Fibonacci at $ 381.34.

| Date | Price $ | Result % | Candle Name | Side |
|---|---|---|---|---|
| 001 12 Feb 2024 | Buy Price: 389.39 | Loss: Close Day2 ($ 384.78) | Abandoned Baby | Buy |
| 002 13 Dec 2023 | Buy Price: 377.01 | Profit: Open Day1 ($ 381.24) | Engulfing | Buy |
| 003 25 Sep 2023 | Buy Price: 384.39 | Loss: Close Day2 ($ 384.36) | Engulfing | Buy |
| 004 18 Sep 2023 | Sell Price: 410.84 | Profit: Open Day1 ($ 402.59) | Abandoned Baby | Sell |
| 005 23 Aug 2023 | Buy Price: 394.28 | Loss: Close Day2 ($ 390.21) | Engulfing | Buy |
| 006One Year Average | Both Sides Result for 5 Signals |
Profit: $ 3.77 ($ 0.75 / Signal) |
All of Them | Buy + Sell |
| Simple Moving Averages (SMA) Period | Value $ | Signal | Exponential Moving Averages (EMA) Period | Value $ | Signal | |
|---|---|---|---|---|---|---|
| 2 | 389.46 | SELL | 2 | 389.60 | SELL | |
| 3 | 393.29 | SELL | 3 | 391.01 | SELL | |
| 5 | 393.45 | SELL | 5 | 392.67 | SELL | |
| 8 | 394.84 | SELL | 8 | 394.26 | SELL | |
| 13 | 395.64 | SELL | 13 | 395.95 | SELL | |
| 21 | 400.63 | SELL | 21 | 396.62 | SELL | |
| 34 | 399.08 | SELL | 34 | 395.25 | SELL | |
| 55 | 387.09 | BUY | 55 | 392.54 | SELL | |
| 90 | 388.81 | SELL | 90 | 390.07 | SELL | |
| 200 | 391.22 | SELL | 200 | 389.26 | SELL |
Deere & Co
IPO: 1933-06-29
Ticker: DEIndices: S&P 500,
Exchange: New York Stock Exchange, Inc. (US - USD)
Website: https://www.deere.com/
Phone:
Common Stock
Technology (
Farm Machinery & Equipment
 Click to Enlarge