| Date | Price $ | Result % | Candle Name | Side |
|---|---|---|---|---|
| 001 02 May 2024 | Buy Price: 145.46 | Profit: Open Day1 ($ 150.00) | Abandoned Baby | Buy |
| 002 14 Mar 2024 | Sell Price: 150.32 | Profit: Open Day1 ($ 149.11) | Abandoned Baby | Sell |
| 003 12 Mar 2024 | Buy Price: 154.62 | Profit: Open Day1 ($ 155.06) | Engulfing | Buy |
| 004 08 Mar 2024 | Sell Price: 153.58 | Profit: Open Day1 ($ 153.23) | Engulfing | Sell |
| 005 08 Mar 2024 | Sell Price: 153.66 | Profit: Open Day1 ($ 153.23) | Dark Cloud Cover | Sell |
| 006 26 Feb 2024 | Sell Price: 145.86 | Profit: Close Day1 ($ 145.44) | Dark Cloud Cover | Sell |
| 007 26 Oct 2023 | Buy Price: 101.65 | Profit: Open Day1 ($ 101.98) | Abandoned Baby | Buy |
| 008 01 Aug 2023 | Buy Price: 127.92 | Loss: Close Day2 ($ 123.15) | Piercing Line | Buy |
| 009One Year Average | Both Sides Result for 8 Signals |
Profit: $ 2.95 ($ 0.37 / Signal) |
All of Them | Buy + Sell |
| Simple Moving Averages (SMA) Period | Value $ | Signal | Exponential Moving Averages (EMA) Period | Value $ | Signal | |
|---|---|---|---|---|---|---|
| 2 | 149.87 | BUY | 2 | 149.90 | BUY | |
| 3 | 148.40 | BUY | 3 | 148.84 | BUY | |
| 5 | 146.03 | BUY | 5 | 147.59 | BUY | |
| 8 | 145.71 | BUY | 8 | 146.87 | BUY | |
| 13 | 145.46 | BUY | 13 | 146.98 | BUY | |
| 21 | 147.50 | BUY | 21 | 147.99 | BUY | |
| 34 | 152.09 | SELL | 34 | 149.09 | BUY | |
| 55 | 151.11 | BUY | 55 | 149.05 | BUY | |
| 90 | 149.87 | BUY | 90 | 146.55 | BUY | |
| 200 | 133.67 | BUY | 200 | 135.83 | BUY |
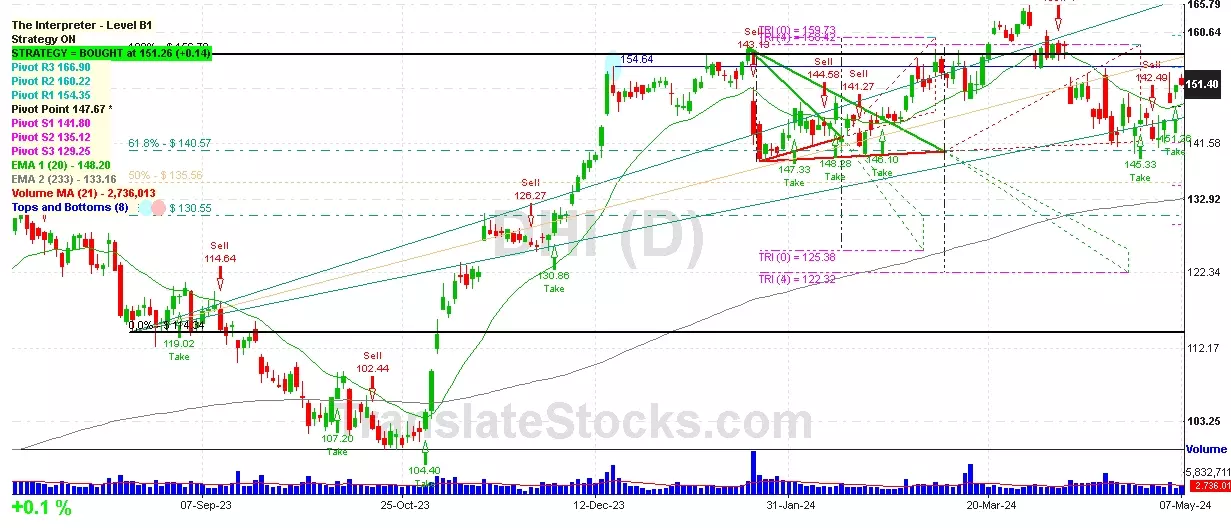
Dr Horton Inc
IPO: 1995-12-14
Ticker: DHIIndices: S&P 500,
Exchange: New York Stock Exchange, Inc. (US - USD)
Website: https://www.drhorton.com/
Phone:
Common Stock
Real Estate & Construction (
Operative Builders

 Click to Enlarge