
| Date | Price $ | Result % | Candle Name | Side |
|---|---|---|---|---|
| 001 17 Apr 2024 | Buy Price: 138.04 | Profit: Open Day1 ($ 139.33) | Abandoned Baby | Buy |
| 002 01 Apr 2024 | Sell Price: 152.03 | Profit: Open Day2 ($ 151.26) | Engulfing | Sell |
| 003 20 Mar 2024 | Buy Price: 146.76 | Profit: Open Day1 ($ 147.50) | Piercing Line | Buy |
| 004 20 Feb 2024 | Sell Price: 145.11 | Profit: Open Day1 ($ 144.76) | Abandoned Baby | Sell |
| 005 12 Jan 2024 | Sell Price: 134.81 | Profit: Open Day1 ($ 133.74) | Engulfing | Sell |
| 006 14 Nov 2023 | Buy Price: 122.82 | Profit: Open Day1 ($ 124.00) | Abandoned Baby | Buy |
| 007 09 Nov 2023 | Sell Price: 115.32 | Profit: Close Day1 ($ 114.75) | Dark Cloud Cover | Sell |
| 008 02 Nov 2023 | Buy Price: 114.38 | Profit: Open Day1 ($ 116.41) | Engulfing | Buy |
| 009 20 Jun 2023 | Sell Price: 197.55 | Profit: Open Day1 ($ 196.30) | Abandoned Baby | Sell |
| 010 15 May 2023 | Buy Price: 201.19 | Profit: Open Day1 ($ 201.50) | Abandoned Baby | Buy |
| 011One Year Average | Both Sides Result for 10 Signals |
Profit: $ 9.56 ($ 0.96 / Signal) |
All of Them | Buy + Sell |
| Simple Moving Averages (SMA) Period | Value $ | Signal | Exponential Moving Averages (EMA) Period | Value $ | Signal | |
|---|---|---|---|---|---|---|
| 2 | 131.51 | SELL | 2 | 131.21 | SELL | |
| 3 | 132.65 | SELL | 3 | 132.27 | SELL | |
| 5 | 134.41 | SELL | 5 | 134.42 | SELL | |
| 8 | 138.91 | SELL | 8 | 136.81 | SELL | |
| 13 | 141.87 | SELL | 13 | 139.09 | SELL | |
| 21 | 141.88 | SELL | 21 | 141.00 | SELL | |
| 34 | 143.52 | SELL | 34 | 142.41 | SELL | |
| 55 | 145.60 | SELL | 55 | 142.89 | SELL | |
| 90 | 142.36 | SELL | 90 | 143.25 | SELL | |
| 200 | 143.70 | SELL | 200 | 153.58 | SELL |
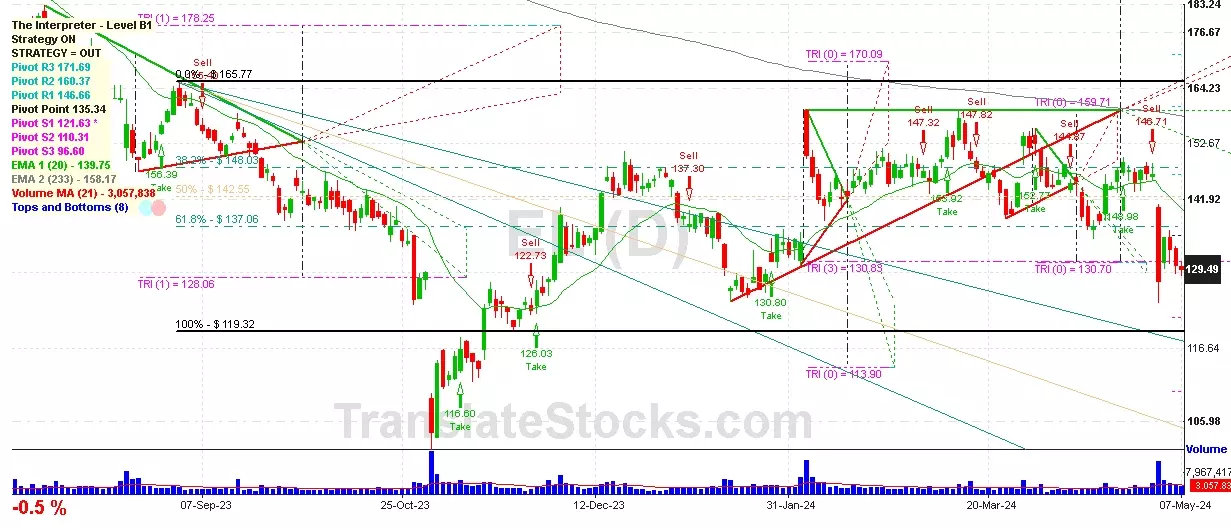
Estee Lauder Companies-cl A
IPO: 1995-11-17
Ticker: ELIndices: S&P 500,
Exchange: New York Stock Exchange, Inc. (US - USD)
Website: https://www.elcompanies.com/
Phone:
Common Stock
Life Sciences (
Perfumes, Cosmetics & Other Toilet Preparations

 Click to Enlarge