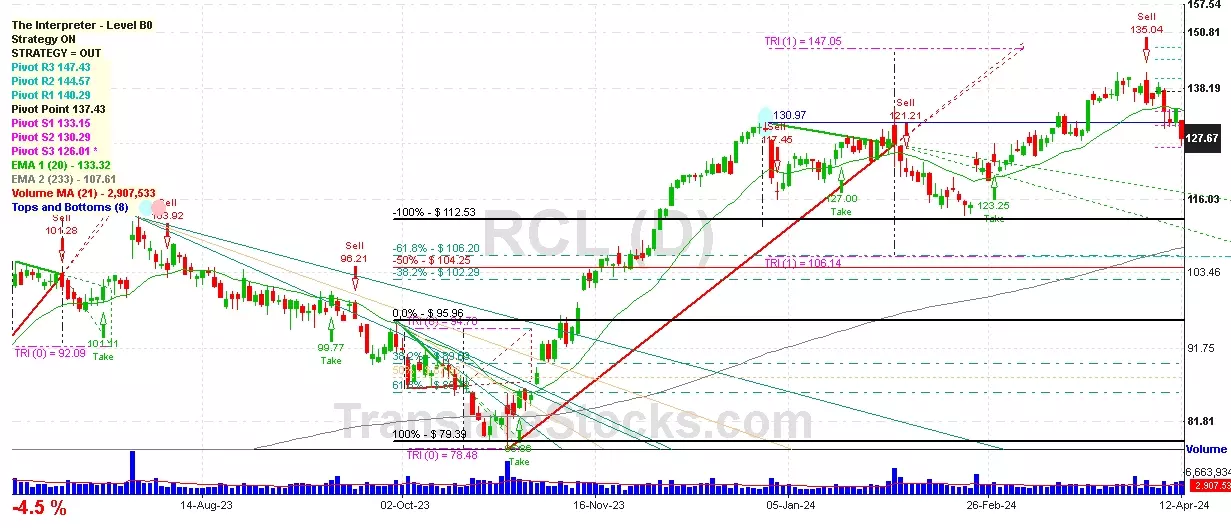
| Date | Price $ | Result % | Candle Name | Side |
|---|---|---|---|---|
| 001 28 Mar 2024 | Sell Price: 137.75 | Profit: Open Day1 ($ 137.55) | Engulfing | Sell |
| 002 26 Mar 2024 | Sell Price: 136.62 | Loss: Close Day2 ($ 137.75) | Engulfing | Sell |
| 003 19 Mar 2024 | Buy Price: 135.56 | Profit: Close Day1 ($ 138.10) | Engulfing | Buy |
| 004 18 Jan 2024 | Buy Price: 148.96 | Profit: Open Day1 ($ 149.94) | Abandoned Baby | Buy |
| 005 27 Jul 2023 | Sell Price: 118.82 | Loss: Close Day2 ($ 122.53) | Dark Cloud Cover | Sell |
| 006 24 Jul 2023 | Sell Price: 116.83 | Loss: Close Day2 ($ 119.56) | Abandoned Baby | Sell |
| 007 21 Jul 2023 | Buy Price: 119.00 | Loss: Close Day2 ($ 117.43) | Abandoned Baby | Buy |
| 008 29 Jun 2023 | Sell Price: 107.84 | Loss: Close Day2 ($ 112.79) | Abandoned Baby | Sell |
| 009 20 Jun 2023 | Buy Price: 106.92 | Profit: Close Day2 ($ 107.33) | Piercing Line | Buy |
| 010 31 May 2023 | Sell Price: 95.71 | Profit: Open Day1 ($ 95.63) | Abandoned Baby | Sell |
| 011One Year Average | Both Sides Result for 10 Signals |
Loss: $ -9.88 ($ -0.99 / Signal) |
All of Them | Buy + Sell |
| Simple Moving Averages (SMA) Period | Value $ | Signal | Exponential Moving Averages (EMA) Period | Value $ | Signal | |
|---|---|---|---|---|---|---|
| 2 | 135.98 | SELL | 2 | 135.75 | SELL | |
| 3 | 135.92 | SELL | 3 | 135.47 | BUY | |
| 5 | 134.87 | BUY | 5 | 134.64 | BUY | |
| 8 | 132.55 | BUY | 8 | 133.70 | BUY | |
| 13 | 131.77 | BUY | 13 | 133.06 | BUY | |
| 21 | 132.10 | BUY | 21 | 133.08 | BUY | |
| 34 | 133.69 | BUY | 34 | 133.90 | BUY | |
| 55 | 134.74 | BUY | 55 | 135.02 | BUY | |
| 90 | 140.85 | SELL | 90 | 134.59 | BUY | |
| 200 | 125.91 | BUY | 200 | 128.23 | BUY |
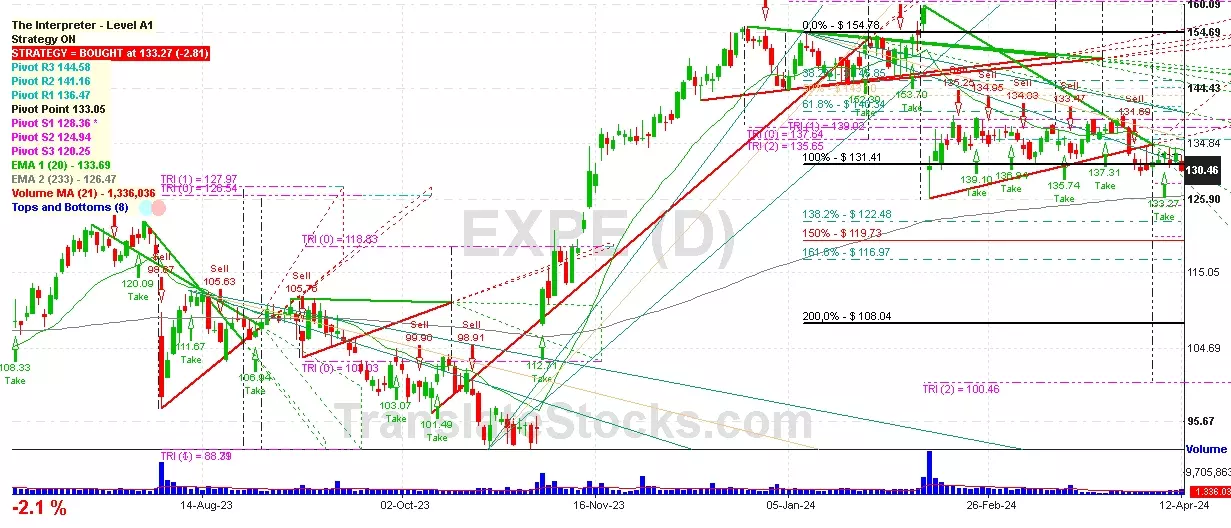
Expedia Group Inc
IPO: 2005-08-09
Ticker: EXPEIndices: S&P 500,
Exchange: Nasdaq Nms - Global Market (US - USD)
Website: http://www.expediainc.com/
Phone:
Common Stock
Energy & Transportation (
Transportation Services

 Click to Enlarge