| Date | Price $ | Result % | Candle Name | Side |
|---|---|---|---|---|
| 001 10 Apr 2024 | Sell Price: 125.01 | Profit: Close Day1 ($ 124.54) | Abandoned Baby | Sell |
| 002 08 Apr 2024 | Buy Price: 128.06 | Profit: Open Day1 ($ 128.79) | Abandoned Baby | Buy |
| 003 02 Jan 2024 | Buy Price: 127.17 | Loss: Close Day2 ($ 125.84) | Piercing Line | Buy |
| 004 29 Dec 2023 | Sell Price: 127.00 | Profit: Open Day1 ($ 126.21) | Abandoned Baby | Sell |
| 005 05 Jun 2023 | Sell Price: 98.10 | Profit: Open Day1 ($ 97.76) | Engulfing | Sell |
| 006 01 May 2023 | Sell Price: 103.00 | Profit: Close Day1 ($ 100.72) | Abandoned Baby | Sell |
| 007One Year Average | Both Sides Result for 6 Signals |
Profit: $ 3.28 ($ 0.55 / Signal) |
All of Them | Buy + Sell |
| Simple Moving Averages (SMA) Period | Value $ | Signal | Exponential Moving Averages (EMA) Period | Value $ | Signal | |
|---|---|---|---|---|---|---|
| 2 | 124.60 | SELL | 2 | 124.84 | SELL | |
| 3 | 125.56 | SELL | 3 | 125.01 | SELL | |
| 5 | 125.55 | SELL | 5 | 124.99 | SELL | |
| 8 | 124.38 | BUY | 8 | 124.92 | SELL | |
| 13 | 124.22 | BUY | 13 | 125.20 | SELL | |
| 21 | 125.82 | SELL | 21 | 126.04 | SELL | |
| 34 | 128.29 | SELL | 34 | 127.22 | SELL | |
| 55 | 129.98 | SELL | 55 | 127.96 | SELL | |
| 90 | 130.18 | SELL | 90 | 127.35 | SELL | |
| 200 | 123.11 | BUY | 200 | 123.38 | BUY |
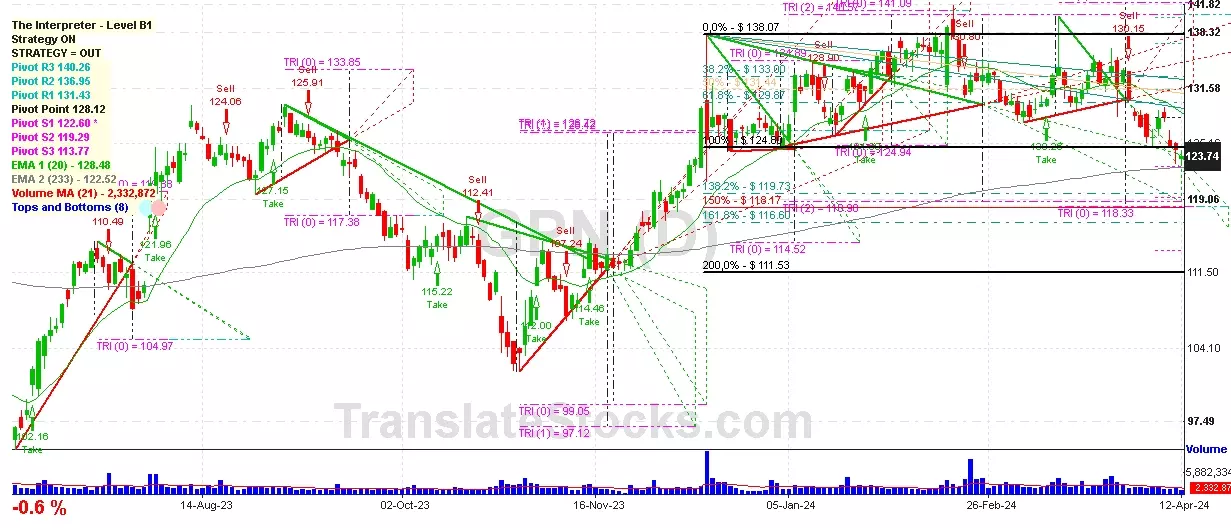
Global Payments Inc
IPO: 2001-01-12
Ticker: GPNIndices: S&P 500,
Exchange: New York Stock Exchange, Inc. (US - USD)
Website: https://www.globalpaymentsinc.com/
Phone:
Common Stock
Trade & Services (
Services-business Services, Nec

 Click to Enlarge