| Date | Price $ | Result % | Candle Name | Side |
|---|---|---|---|---|
| 001 04 Apr 2024 | Buy Price: 55.85 | Profit: Open Day1 ($ 56.08) | Abandoned Baby | Buy |
| 002 22 Feb 2024 | Buy Price: 50.16 | Profit: Open Day1 ($ 50.39) | Abandoned Baby | Buy |
| 003 28 Dec 2023 | Buy Price: 51.47 | Loss: Close Day2 ($ 49.90) | Engulfing | Buy |
| 004 12 Dec 2023 | Sell Price: 48.37 | Loss: Close Day2 ($ 51.29) | Abandoned Baby | Sell |
| 005 21 Nov 2023 | Buy Price: 45.15 | Profit: Close Day1 ($ 45.62) | Engulfing | Buy |
| 006 21 Nov 2023 | Buy Price: 45.08 | Profit: Close Day1 ($ 45.62) | Piercing Line | Buy |
| 007 10 Oct 2023 | Buy Price: 59.56 | Profit: Open Day1 ($ 59.66) | Abandoned Baby | Buy |
| 008 19 Sep 2023 | Buy Price: 66.28 | Profit: Close Day1 ($ 66.66) | Piercing Line | Buy |
| 009 10 Jul 2023 | Sell Price: 64.08 | Loss: Close Day2 ($ 64.89) | Engulfing | Sell |
| 010 31 May 2023 | Sell Price: 59.35 | Profit: Open Day1 ($ 58.46) | Abandoned Baby | Sell |
| 011One Year Average | Both Sides Result for 10 Signals |
Loss: $ -2.46 ($ -0.25 / Signal) |
All of Them | Buy + Sell |
| Simple Moving Averages (SMA) Period | Value $ | Signal | Exponential Moving Averages (EMA) Period | Value $ | Signal | |
|---|---|---|---|---|---|---|
| 2 | 61.33 | BUY | 2 | 61.36 | BUY | |
| 3 | 61.00 | BUY | 3 | 61.41 | BUY | |
| 5 | 61.72 | SELL | 5 | 61.51 | SELL | |
| 8 | 62.88 | SELL | 8 | 61.26 | BUY | |
| 13 | 60.16 | BUY | 13 | 60.48 | BUY | |
| 21 | 58.71 | BUY | 21 | 59.29 | BUY | |
| 34 | 57.43 | BUY | 34 | 57.78 | BUY | |
| 55 | 55.00 | BUY | 55 | 56.12 | BUY | |
| 90 | 52.94 | BUY | 90 | 54.89 | BUY | |
| 200 | 55.70 | BUY | 200 | 55.56 | BUY |
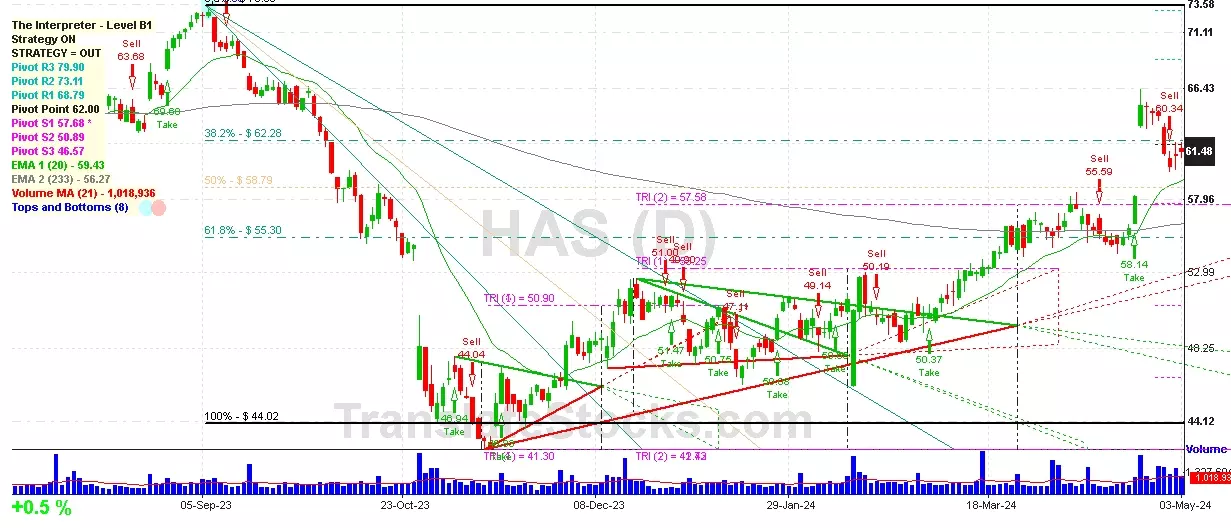
Hasbro Inc
IPO: 1999-06-23
Ticker: HASIndices: S&P 500,
Exchange: Nasdaq Nms - Global Market (US - USD)
Website: https://shop.hasbro.com/en-in
Phone:
Common Stock
Manufacturing (
Games, Toys & Children's Vehicles (no Dolls & Bicycles)

 Click to Enlarge