| Date | Price $ | Result % | Candle Name | Side |
|---|---|---|---|---|
| 001 24 Apr 2024 | Sell Price: 99.86 | Profit: Open Day1 ($ 99.77) | Abandoned Baby | Sell |
| 002 14 Mar 2024 | Sell Price: 98.97 | Profit: Open Day1 ($ 98.18) | Abandoned Baby | Sell |
| 003 26 Jan 2024 | Sell Price: 86.88 | Profit: Open Day1 ($ 86.55) | Abandoned Baby | Sell |
| 004 26 Jan 2024 | Sell Price: 86.81 | Profit: Open Day1 ($ 86.55) | Engulfing | Sell |
| 005 22 Dec 2023 | Buy Price: 79.57 | Profit: Open Day1 ($ 79.59) | Abandoned Baby | Buy |
| 006 06 Dec 2023 | Sell Price: 78.39 | Profit: Close Day1 ($ 78.29) | Engulfing | Sell |
| 007 06 Dec 2023 | Sell Price: 78.30 | Profit: Close Day1 ($ 78.29) | Dark Cloud Cover | Sell |
| 008 02 Nov 2023 | Sell Price: 73.62 | Loss: Close Day2 ($ 73.97) | Abandoned Baby | Sell |
| 009 02 Nov 2023 | Sell Price: 73.57 | Loss: Close Day2 ($ 73.97) | Engulfing | Sell |
| 010 30 Aug 2023 | Sell Price: 72.16 | Profit: Open Day1 ($ 71.90) | Engulfing | Sell |
| 011 30 Aug 2023 | Sell Price: 72.18 | Profit: Open Day1 ($ 71.90) | Dark Cloud Cover | Sell |
| 012 23 Aug 2023 | Buy Price: 71.32 | Profit: Close Day1 ($ 71.60) | Abandoned Baby | Buy |
| 013 01 Aug 2023 | Buy Price: 71.99 | Profit: Close Day1 ($ 72.19) | Piercing Line | Buy |
| 014 28 Jul 2023 | Sell Price: 72.24 | Profit: Open Day1 ($ 72.01) | Engulfing | Sell |
| 015 14 Jun 2023 | Sell Price: 70.64 | Profit: Open Day1 ($ 70.50) | Engulfing | Sell |
| 016 10 May 2023 | Sell Price: 69.88 | Profit: Open Day1 ($ 69.35) | Engulfing | Sell |
| 017One Year Average | Both Sides Result for 16 Signals |
Profit: $ 2.75 ($ 0.17 / Signal) |
All of Them | Buy + Sell |
| Simple Moving Averages (SMA) Period | Value $ | Signal | Exponential Moving Averages (EMA) Period | Value $ | Signal | |
|---|---|---|---|---|---|---|
| 2 | 97.20 | SELL | 2 | 96.65 | SELL | |
| 3 | 98.08 | SELL | 3 | 97.34 | SELL | |
| 5 | 98.82 | SELL | 5 | 97.91 | SELL | |
| 8 | 98.22 | SELL | 8 | 98.23 | SELL | |
| 13 | 98.10 | SELL | 13 | 98.56 | SELL | |
| 21 | 99.59 | SELL | 21 | 98.77 | SELL | |
| 34 | 99.76 | SELL | 34 | 98.27 | SELL | |
| 55 | 97.60 | SELL | 55 | 96.40 | SELL | |
| 90 | 92.23 | BUY | 90 | 92.89 | BUY | |
| 200 | 81.95 | BUY | 200 | 85.48 | BUY |
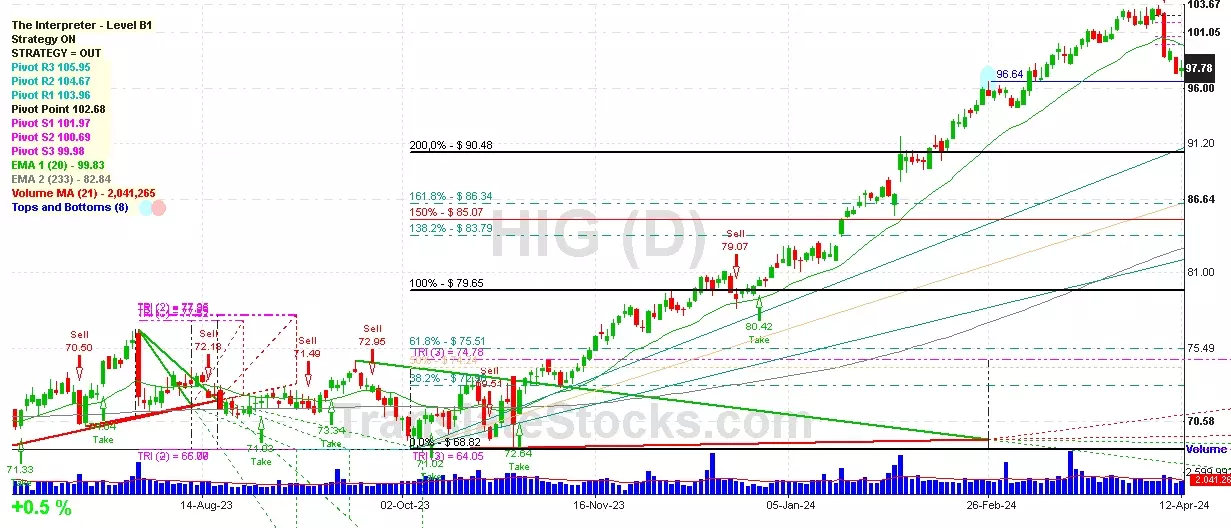
Hartford Financial Svcs Grp
IPO: 1985-12-09
Ticker: HIGIndices: S&P 500,
Exchange: New York Stock Exchange, Inc. (US - USD)
Website: https://www.thehartford.com/
Phone:
Common Stock
Finance (
Fire, Marine & Casualty Insurance

 Click to Enlarge