| Date | Price $ | Result % | Candle Name | Side |
|---|---|---|---|---|
| 001 06 Feb 2024 | Buy Price: 33.14 | Profit: Open Day1 ($ 33.45) | Piercing Line | Buy |
| 002 02 Jan 2024 | Buy Price: 36.54 | Loss: Close Day2 ($ 36.47) | Abandoned Baby | Buy |
| 003 05 Oct 2023 | Sell Price: 34.95 | Profit: Close Day1 ($ 34.55) | Abandoned Baby | Sell |
| 004 04 Oct 2023 | Buy Price: 35.44 | Loss: Close Day2 ($ 34.55) | Abandoned Baby | Buy |
| 005 15 Sep 2023 | Sell Price: 34.24 | Profit: Close Day1 ($ 34.16) | Engulfing | Sell |
| 006 05 Sep 2023 | Sell Price: 34.32 | Profit: Open Day1 ($ 34.26) | Abandoned Baby | Sell |
| 007 25 Aug 2023 | Buy Price: 33.93 | Profit: Open Day1 ($ 34.08) | Abandoned Baby | Buy |
| 008 04 Aug 2023 | Sell Price: 36.26 | Profit: Close Day1 ($ 36.14) | Abandoned Baby | Sell |
| 009 02 Aug 2023 | Buy Price: 36.59 | Profit: Open Day1 ($ 36.61) | Engulfing | Buy |
| 010 18 Jul 2023 | Buy Price: 31.36 | Profit: Open Day1 ($ 31.38) | Engulfing | Buy |
| 011 05 Jul 2023 | Sell Price: 31.33 | Profit: Open Day1 ($ 31.16) | Abandoned Baby | Sell |
| 012One Year Average | Both Sides Result for 11 Signals |
Profit: $ 0.37 ($ 0.03 / Signal) |
All of Them | Buy + Sell |
| Simple Moving Averages (SMA) Period | Value $ | Signal | Exponential Moving Averages (EMA) Period | Value $ | Signal | |
|---|---|---|---|---|---|---|
| 2 | 34.58 | BUY | 2 | 34.82 | BUY | |
| 3 | 34.22 | BUY | 3 | 34.63 | BUY | |
| 5 | 34.30 | BUY | 5 | 34.59 | BUY | |
| 8 | 34.61 | BUY | 8 | 34.82 | BUY | |
| 13 | 35.35 | SELL | 13 | 35.34 | SELL | |
| 21 | 36.62 | SELL | 21 | 35.92 | SELL | |
| 34 | 37.17 | SELL | 34 | 36.29 | SELL | |
| 55 | 36.43 | SELL | 55 | 36.37 | SELL | |
| 90 | 36.38 | SELL | 90 | 36.20 | SELL | |
| 200 | 35.36 | SELL | 200 | 35.80 | SELL |
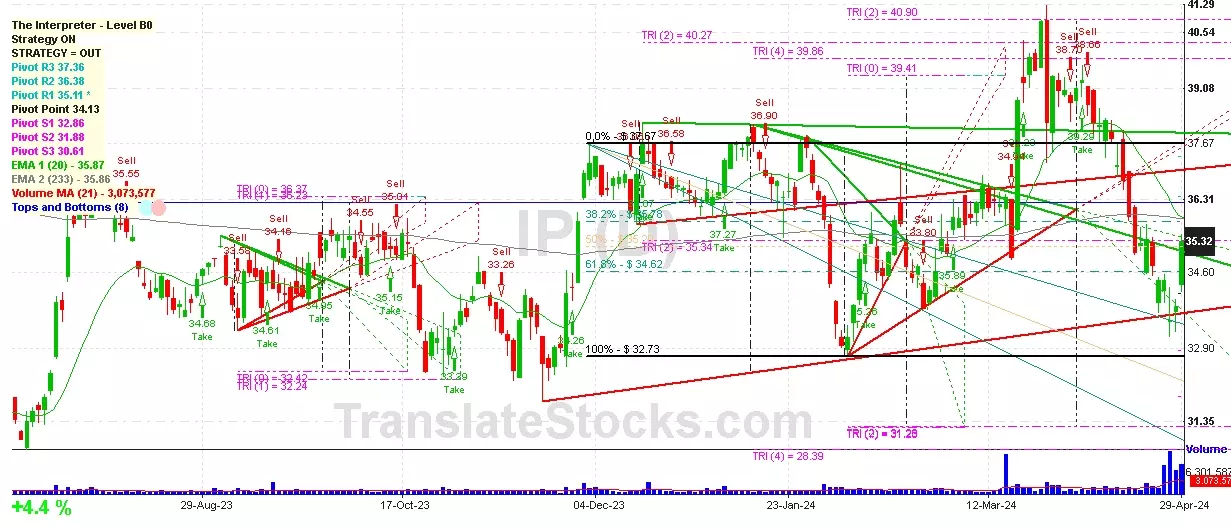
International Paper Co
IPO: 1941-10-06
Ticker: IPIndices: S&P 500,
Exchange: New York Stock Exchange, Inc. (US - USD)
Website: http://www.internationalpaper.com
Phone:
Common Stock
Manufacturing (
Paper Mills

 Click to Enlarge