| Date | Price $ | Result % | Candle Name | Side |
|---|---|---|---|---|
| 001 25 Apr 2024 | Buy Price: 165.89 | Profit: Close Day2 ($ 166.12) | Engulfing | Buy |
| 002 22 Apr 2024 | Sell Price: 164.84 | Loss: Close Day2 ($ 165.20) | Engulfing | Sell |
| 003 02 Jan 2024 | Buy Price: 164.66 | Profit: Close Day2 ($ 166.67) | Engulfing | Buy |
| 004 16 Nov 2023 | Sell Price: 153.49 | Profit: Close Day1 ($ 152.30) | Engulfing | Sell |
| 005 16 Nov 2023 | Sell Price: 153.41 | Profit: Close Day1 ($ 152.30) | Dark Cloud Cover | Sell |
| 006 11 Oct 2023 | Sell Price: 147.18 | Profit: Open Day1 ($ 144.16) | Engulfing | Sell |
| 007 12 Sep 2023 | Buy Price: 153.00 | Profit: Open Day1 ($ 153.47) | Engulfing | Buy |
| 008 01 Aug 2023 | Buy Price: 171.63 | Loss: Close Day2 ($ 171.16) | Engulfing | Buy |
| 009 23 Jun 2023 | Buy Price: 162.80 | Profit: Close Day1 ($ 163.68) | Piercing Line | Buy |
| 010One Year Average | Both Sides Result for 9 Signals |
Profit: $ 8.08 ($ 0.90 / Signal) |
All of Them | Buy + Sell |
| Simple Moving Averages (SMA) Period | Value $ | Signal | Exponential Moving Averages (EMA) Period | Value $ | Signal | |
|---|---|---|---|---|---|---|
| 2 | 163.35 | BUY | 2 | 163.67 | BUY | |
| 3 | 163.07 | BUY | 3 | 163.56 | BUY | |
| 5 | 163.60 | BUY | 5 | 163.70 | BUY | |
| 8 | 164.25 | SELL | 8 | 164.10 | BUY | |
| 13 | 164.64 | SELL | 13 | 164.82 | SELL | |
| 21 | 166.33 | SELL | 21 | 165.88 | SELL | |
| 34 | 167.80 | SELL | 34 | 167.05 | SELL | |
| 55 | 169.88 | SELL | 55 | 167.64 | SELL | |
| 90 | 169.02 | SELL | 90 | 166.94 | SELL | |
| 200 | 161.85 | BUY | 200 | 164.97 | SELL |
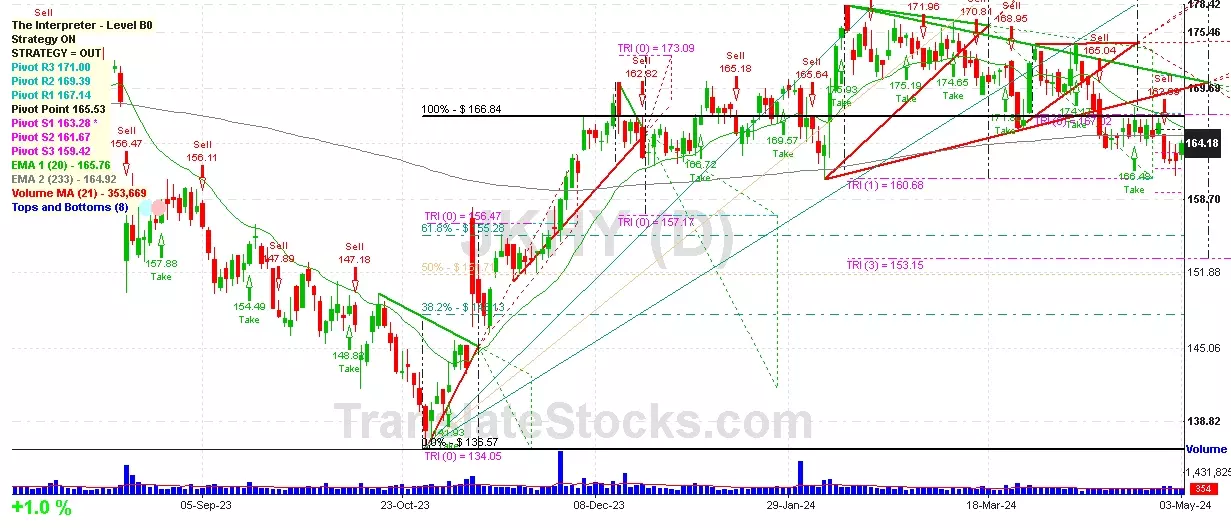
Jack Henry & Associates Inc
IPO: 1985-11-21
Ticker: JKHYIndices: S&P 500,
Exchange: Nasdaq Nms - Global Market (US - USD)
Website: https://www.jackhenry.com
Phone:
Common Stock
Technology (
Services-computer Integrated Systems Design

 Click to Enlarge