| Date | Price $ | Result % | Candle Name | Side |
|---|---|---|---|---|
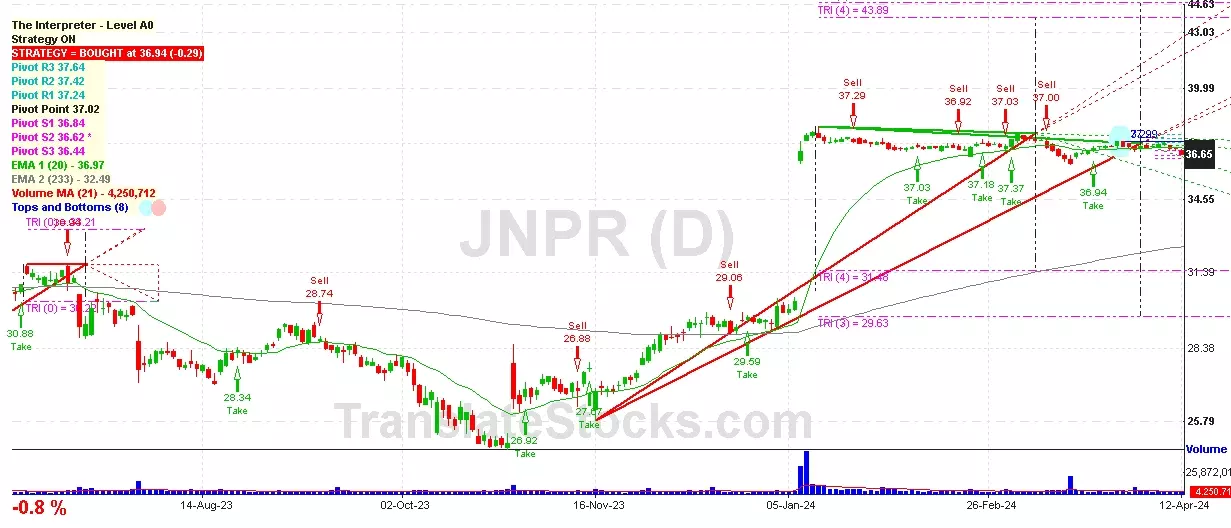
| 001 10 Apr 2024 | Sell Price: 36.97 | Profit: Close Day1 ($ 36.93) | Abandoned Baby | Sell |
| 002 04 Apr 2024 | Sell Price: 36.97 | Loss: Close Day2 ($ 37.13) | Dark Cloud Cover | Sell |
| 003 18 Mar 2024 | Buy Price: 36.71 | Profit: Close Day2 ($ 36.82) | Abandoned Baby | Buy |
| 004 15 Feb 2024 | Sell Price: 37.01 | Profit: Close Day1 ($ 36.92) | Dark Cloud Cover | Sell |
| 005 08 Feb 2024 | Sell Price: 36.95 | Loss: Close Day2 ($ 37.00) | Abandoned Baby | Sell |
| 006 29 Jan 2024 | Buy Price: 37.23 | Profit: Open Day1 ($ 37.25) | Engulfing | Buy |
| 007 03 Jan 2024 | Buy Price: 30.02 | Profit: Open Day1 ($ 30.05) | Engulfing | Buy |
| 008 28 Dec 2023 | Buy Price: 29.51 | Loss: Close Day2 ($ 29.34) | Piercing Line | Buy |
| 009 06 Sep 2023 | Buy Price: 29.25 | Loss: Close Day2 ($ 29.07) | Piercing Line | Buy |
| 010 14 Aug 2023 | Buy Price: 27.77 | Loss: Close Day2 ($ 27.12) | Piercing Line | Buy |
| 011 20 Jun 2023 | Sell Price: 31.50 | Profit: Open Day1 ($ 31.33) | Abandoned Baby | Sell |
| 012One Year Average | Both Sides Result for 11 Signals |
Loss: $ -0.75 ($ -0.07 / Signal) |
All of Them | Buy + Sell |
| Simple Moving Averages (SMA) Period | Value $ | Signal | Exponential Moving Averages (EMA) Period | Value $ | Signal | |
|---|---|---|---|---|---|---|
| 2 | 34.83 | SELL | 2 | 34.86 | SELL | |
| 3 | 35.01 | SELL | 3 | 35.02 | SELL | |
| 5 | 35.40 | SELL | 5 | 35.28 | SELL | |
| 8 | 35.71 | SELL | 8 | 35.57 | SELL | |
| 13 | 36.09 | SELL | 13 | 35.90 | SELL | |
| 21 | 36.46 | SELL | 21 | 36.19 | SELL | |
| 34 | 36.60 | SELL | 34 | 36.36 | SELL | |
| 55 | 36.81 | SELL | 55 | 36.12 | SELL | |
| 90 | 35.78 | SELL | 90 | 35.20 | SELL | |
| 200 | 31.41 | BUY | 200 | 33.11 | BUY |
Juniper Networks Inc
IPO: 2009-10-29
Ticker: JNPRIndices: S&P 500,
Exchange: New York Stock Exchange, Inc. (US - USD)
Website: https://www.juniper.net/
Phone:
Common Stock
Technology (
Computer Communications Equipment

 Click to Enlarge