| Date | Price $ | Result % | Candle Name | Side |
|---|---|---|---|---|
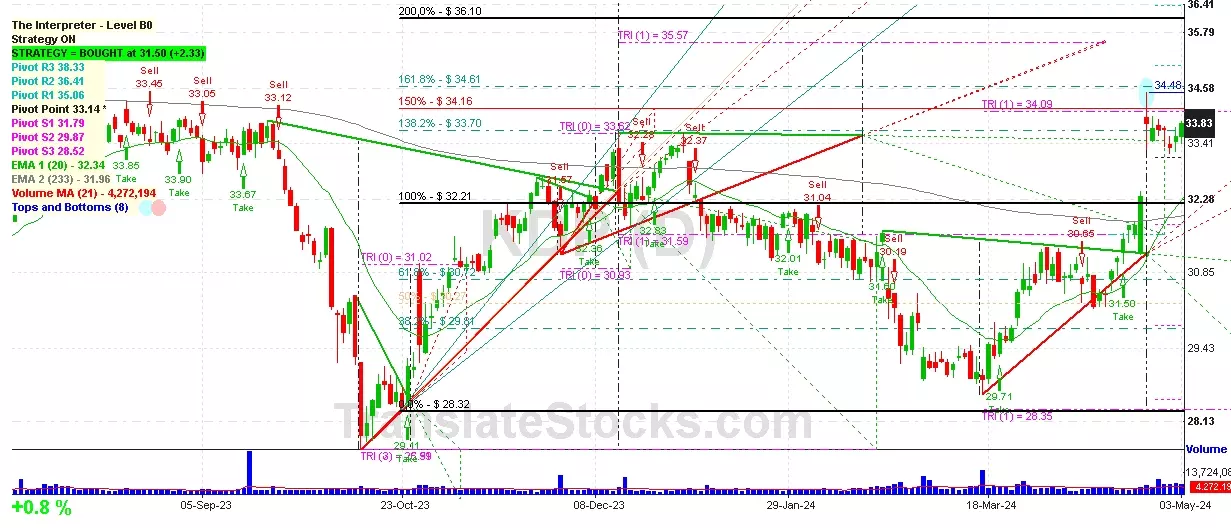
| 001 26 Apr 2024 | Sell Price: 33.72 | Profit: Close Day1 ($ 33.70) | Abandoned Baby | Sell |
| 002 10 Apr 2024 | Sell Price: 30.65 | Profit: Close Day2 ($ 30.22) | Abandoned Baby | Sell |
| 003 07 Mar 2024 | Sell Price: 28.96 | Loss: Close Day2 ($ 29.30) | Abandoned Baby | Sell |
| 004 22 Feb 2024 | Sell Price: 30.37 | Profit: Close Day1 ($ 30.19) | Abandoned Baby | Sell |
| 005 30 Jan 2024 | Sell Price: 31.80 | Profit: Close Day1 ($ 31.44) | Engulfing | Sell |
| 006 14 Dec 2023 | Sell Price: 32.21 | Profit: Open Day1 ($ 32.18) | Engulfing | Sell |
| 007 06 Nov 2023 | Sell Price: 30.97 | Loss: Close Day2 ($ 31.05) | Abandoned Baby | Sell |
| 008 11 Oct 2023 | Sell Price: 29.29 | Profit: Open Day1 ($ 29.18) | Engulfing | Sell |
| 009 05 Oct 2023 | Sell Price: 30.21 | Profit: Open Day1 ($ 30.08) | Engulfing | Sell |
| 010 04 Oct 2023 | Buy Price: 31.70 | Profit: Open Day1 ($ 31.71) | Abandoned Baby | Buy |
| 011 29 Sep 2023 | Buy Price: 31.57 | Loss: Close Day2 ($ 31.09) | Abandoned Baby | Buy |
| 012 21 Sep 2023 | Sell Price: 33.33 | Profit: Open Day1 ($ 33.27) | Engulfing | Sell |
| 013 30 Aug 2023 | Sell Price: 33.77 | Profit: Open Day1 ($ 33.74) | Engulfing | Sell |
| 014 23 Aug 2023 | Buy Price: 33.65 | Loss: Close Day2 ($ 33.28) | Abandoned Baby | Buy |
| 015 10 Aug 2023 | Sell Price: 33.40 | Loss: Close Day2 ($ 33.74) | Engulfing | Sell |
| 016 03 Aug 2023 | Sell Price: 33.93 | Profit: Open Day1 ($ 33.82) | Engulfing | Sell |
| 017 24 Jul 2023 | Sell Price: 32.36 | Profit: Open Day1 ($ 32.30) | Abandoned Baby | Sell |
| 018 07 Jul 2023 | Sell Price: 31.76 | Profit: Open Day1 ($ 31.46) | Abandoned Baby | Sell |
| 019 30 Jun 2023 | Buy Price: 31.27 | Profit: Close Day1 ($ 31.47) | Abandoned Baby | Buy |
| 020 05 Jun 2023 | Sell Price: 31.31 | Profit: Open Day1 ($ 30.88) | Dark Cloud Cover | Sell |
| 021 15 May 2023 | Sell Price: 32.36 | Profit: Open Day1 ($ 32.34) | Engulfing | Sell |
| 022One Year Average | Both Sides Result for 21 Signals |
Profit: $ 0.87 ($ 0.04 / Signal) |
All of Them | Buy + Sell |
| Simple Moving Averages (SMA) Period | Value $ | Signal | Exponential Moving Averages (EMA) Period | Value $ | Signal | |
|---|---|---|---|---|---|---|
| 2 | 33.70 | BUY | 2 | 33.73 | BUY | |
| 3 | 33.58 | BUY | 3 | 33.67 | BUY | |
| 5 | 33.63 | BUY | 5 | 33.55 | BUY | |
| 8 | 33.50 | BUY | 8 | 33.28 | BUY | |
| 13 | 32.70 | BUY | 13 | 32.83 | BUY | |
| 21 | 31.91 | BUY | 21 | 32.28 | BUY | |
| 34 | 31.31 | BUY | 34 | 31.75 | BUY | |
| 55 | 30.71 | BUY | 55 | 31.41 | BUY | |
| 90 | 31.17 | BUY | 90 | 31.31 | BUY | |
| 200 | 31.67 | BUY | 200 | 31.76 | BUY |
Keurig Dr Pepper Inc
IPO: 2008-04-28
Ticker: KDPIndices: Nasdaq 100,
Exchange: Nasdaq Nms - Global Market (US - USD)
Website: https://www.drpeppersnapplegroup.com/
Phone:
Common Stock
Manufacturing (
Beverages
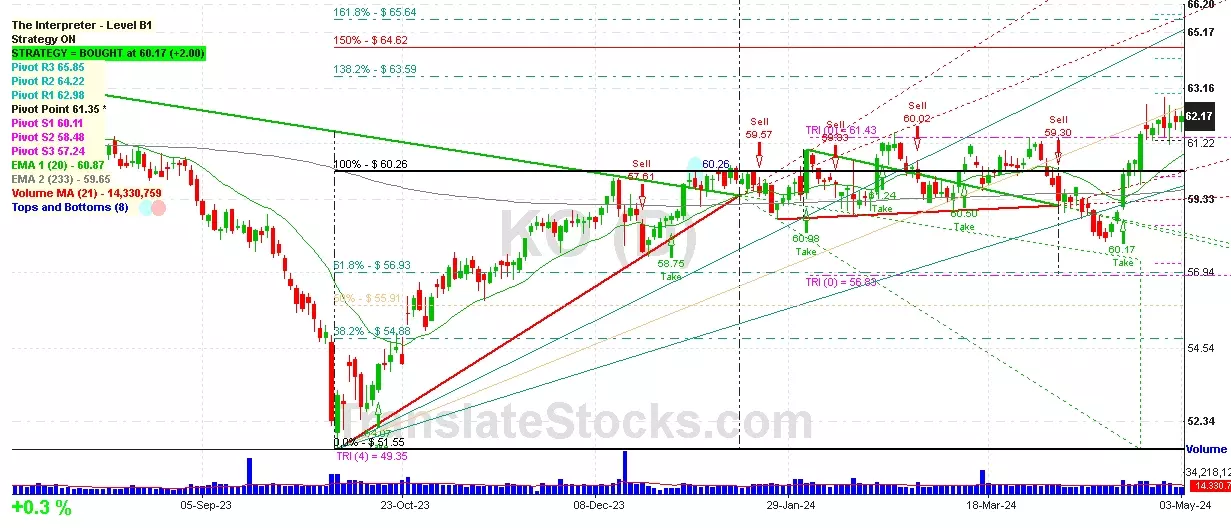
 Click to Enlarge
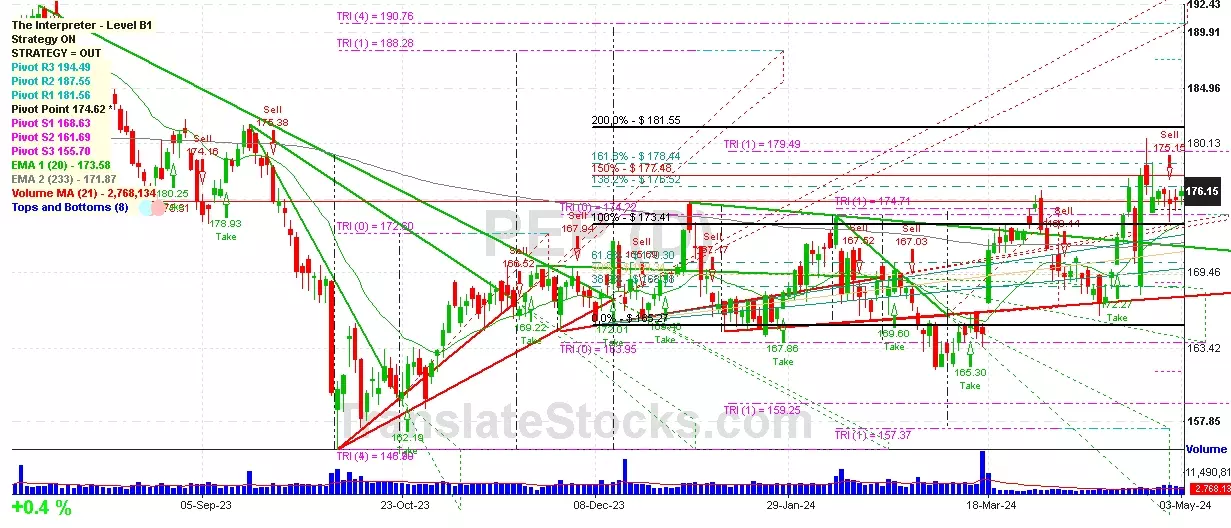