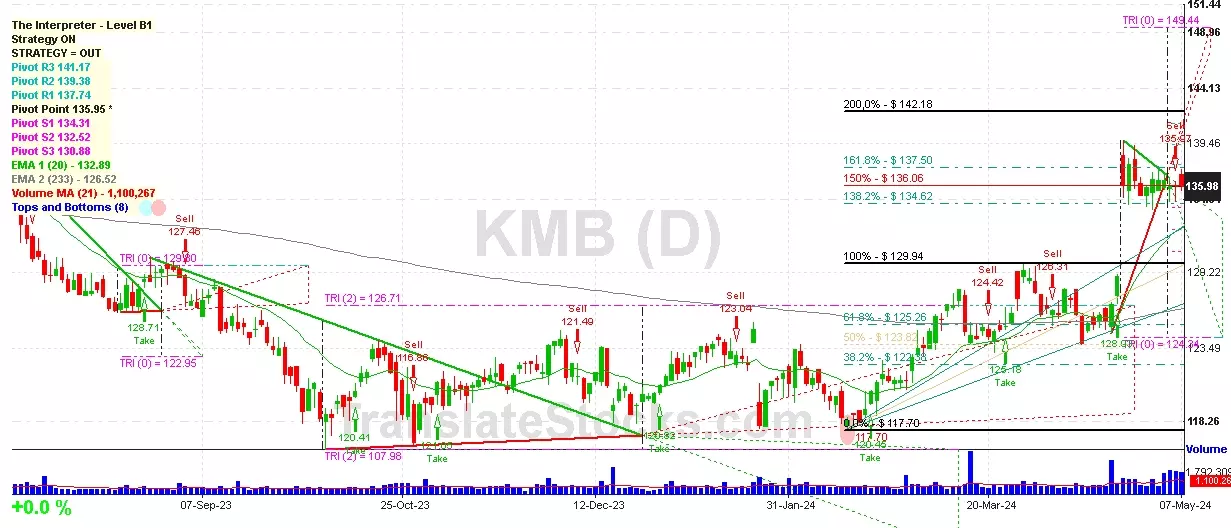
Hey Friend, I'm analysing KIMBERLY CLARK CORP (KMB), and it is between the Support of $ 135.95 (Pivot) and the Resistance of $ 136.06 (150% of Fibonacci). The stock is also approaching the line of Pivot at $ 135.95, and if it goes below this line it could reach the next Support of 138.2% of Fibonacci at $ 134.62.

| Date | Price $ | Result % | Candle Name | Side |
|---|---|---|---|---|
| 001 21 Mar 2024 | Buy Price: 124.81 | Profit: Open Day1 ($ 125.24) | Piercing Line | Buy |
| 002 12 Feb 2024 | Buy Price: 120.07 | Profit: Open Day1 ($ 120.42) | Piercing Line | Buy |
| 003 16 Jan 2024 | Sell Price: 123.07 | Profit: Open Day1 ($ 122.77) | Abandoned Baby | Sell |
| 004 18 Dec 2023 | Buy Price: 120.59 | Profit: Close Day1 ($ 120.77) | Abandoned Baby | Buy |
| 005 20 Sep 2023 | Buy Price: 124.93 | Profit: Open Day1 ($ 125.60) | Abandoned Baby | Buy |
| 006 24 Aug 2023 | Sell Price: 128.54 | Loss: Close Day2 ($ 129.44) | Engulfing | Sell |
| 007 27 Jun 2023 | Buy Price: 138.27 | Loss: Close Day2 ($ 137.16) | Engulfing | Buy |
| 008 14 Jun 2023 | Buy Price: 135.12 | Profit: Open Day1 ($ 135.94) | Abandoned Baby | Buy |
| 009 01 Jun 2023 | Sell Price: 133.93 | Profit: Open Day1 ($ 133.71) | Engulfing | Sell |
| 010 15 May 2023 | Sell Price: 143.85 | Loss: Close Day2 ($ 144.85) | Engulfing | Sell |
| 011 15 May 2023 | Sell Price: 143.74 | Loss: Close Day2 ($ 144.85) | Dark Cloud Cover | Sell |
| 012One Year Average | Both Sides Result for 11 Signals |
Loss: $ -1.15 ($ -0.10 / Signal) |
All of Them | Buy + Sell |
| Simple Moving Averages (SMA) Period | Value $ | Signal | Exponential Moving Averages (EMA) Period | Value $ | Signal | |
|---|---|---|---|---|---|---|
| 2 | 135.98 | BUY | 2 | 136.00 | SELL | |
| 3 | 136.01 | SELL | 3 | 136.04 | SELL | |
| 5 | 136.20 | SELL | 5 | 136.00 | SELL | |
| 8 | 136.09 | SELL | 8 | 135.56 | BUY | |
| 13 | 134.98 | BUY | 13 | 134.41 | BUY | |
| 21 | 131.53 | BUY | 21 | 132.70 | BUY | |
| 34 | 129.57 | BUY | 34 | 130.67 | BUY | |
| 55 | 127.25 | BUY | 55 | 128.58 | BUY | |
| 90 | 125.05 | BUY | 90 | 126.84 | BUY | |
| 200 | 124.33 | BUY | 200 | 126.29 | BUY |
Kimberly-clark Corp
IPO: 1929-05-09
Ticker: KMBIndices: S&P 500,
Exchange: New York Stock Exchange, Inc. (US - USD)
Website: https://www.kimberly-clark.com
Phone:
Common Stock
Manufacturing (
Converted Paper & Paperboard Prods (no Contaners/boxes)
 Click to Enlarge