| Date | Price $ | Result % | Candle Name | Side |
|---|---|---|---|---|
| 001 02 Nov 2023 | Buy Price: 48.69 | Profit: Open Day1 ($ 49.14) | Abandoned Baby | Buy |
| 002 21 Jun 2023 | Sell Price: 58.32 | Profit: Open Day1 ($ 58.22) | Engulfing | Sell |
| 003One Year Average | Both Sides Result for 2 Signals |
Profit: $ 0.55 ($ 0.28 / Signal) |
All of Them | Buy + Sell |
| Simple Moving Averages (SMA) Period | Value $ | Signal | Exponential Moving Averages (EMA) Period | Value $ | Signal | |
|---|---|---|---|---|---|---|
| 2 | 45.50 | SELL | 2 | 45.53 | SELL | |
| 3 | 45.61 | SELL | 3 | 45.64 | SELL | |
| 5 | 45.88 | SELL | 5 | 45.98 | SELL | |
| 8 | 46.37 | SELL | 8 | 46.65 | SELL | |
| 13 | 48.13 | SELL | 13 | 47.66 | SELL | |
| 21 | 49.91 | SELL | 21 | 48.74 | SELL | |
| 34 | 50.45 | SELL | 34 | 49.67 | SELL | |
| 55 | 51.50 | SELL | 55 | 50.21 | SELL | |
| 90 | 50.81 | SELL | 90 | 50.42 | SELL | |
| 200 | 50.59 | SELL | 200 | 50.72 | SELL |
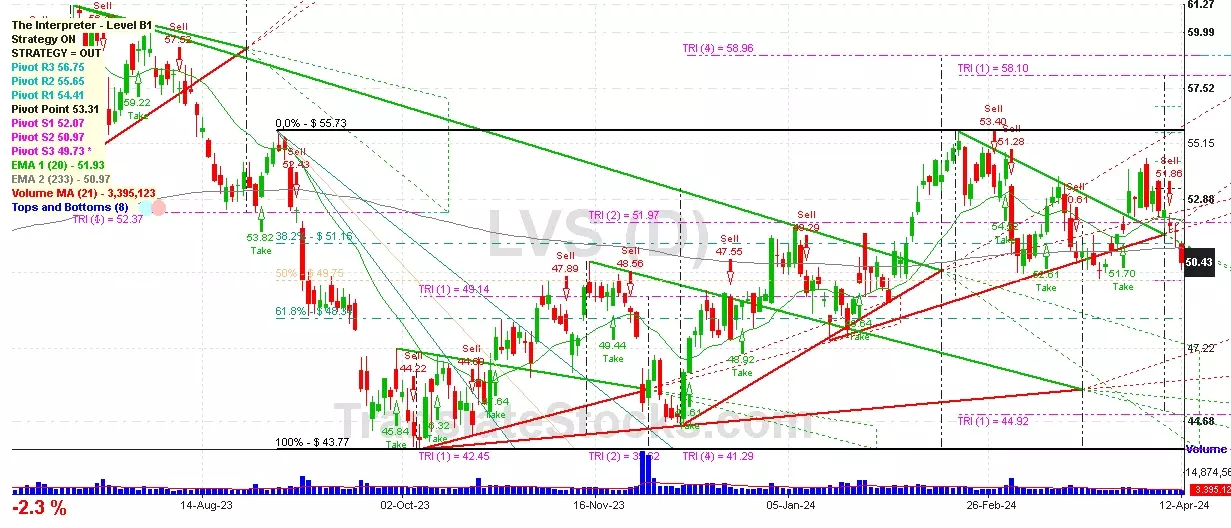
Las Vegas Sands Corp
IPO: 2004-12-15
Ticker: LVSIndices: S&P 500,
Exchange: New York Stock Exchange, Inc. (US - USD)
Website: https://www.sands.com/
Phone:
Common Stock
Real Estate & Construction (
Hotels & Motels

 Click to Enlarge