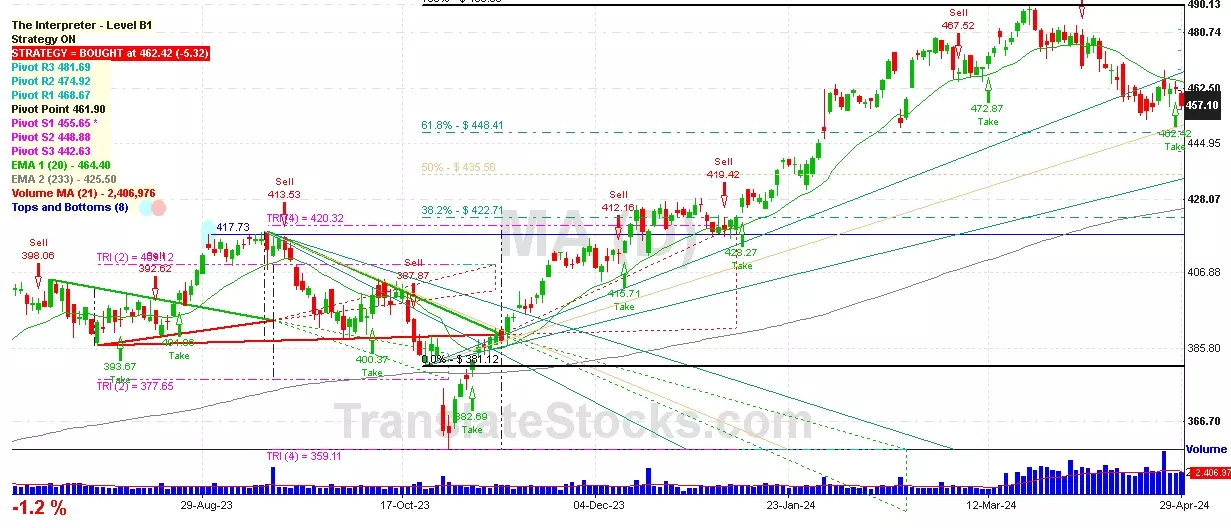
Hey Friend, I'm analysing MASTERCARD INC A (MA), and it is between the Support of $ 455.65 (PivotS1) and the Resistance of $ 461.90 (Pivot). The stock is also approaching the line of PivotS1 at $ 455.65, and if it goes below this line it could reach the next Support of 61.8% of Fibonacci at $ 448.41.

| Date | Price $ | Result % | Candle Name | Side |
|---|---|---|---|---|
| 001 07 Mar 2024 | Sell Price: 466.97 | Loss: Close Day2 ($ 469.16) | Engulfing | Sell |
| 002 07 Mar 2024 | Sell Price: 467.54 | Profit: Open Day1 ($ 467.10) | Dark Cloud Cover | Sell |
| 003 12 Feb 2024 | Buy Price: 458.71 | Profit: Close Day1 ($ 460.46) | Abandoned Baby | Buy |
| 004 12 Feb 2024 | Sell Price: 458.24 | Profit: Open Day1 ($ 456.76) | Dark Cloud Cover | Sell |
| 005 18 Jan 2024 | Buy Price: 430.72 | Profit: Open Day1 ($ 432.55) | Abandoned Baby | Buy |
| 006 11 Jan 2024 | Sell Price: 426.72 | Loss: Close Day2 ($ 428.35) | Dark Cloud Cover | Sell |
| 007 02 Jan 2024 | Sell Price: 421.89 | Profit: Open Day1 ($ 421.20) | Abandoned Baby | Sell |
| 008 27 Dec 2023 | Buy Price: 424.36 | Profit: Close Day1 ($ 426.32) | Piercing Line | Buy |
| 009 27 Nov 2023 | Sell Price: 408.97 | Loss: Close Day2 ($ 409.82) | Abandoned Baby | Sell |
| 010 09 Nov 2023 | Sell Price: 387.84 | Loss: Close Day2 ($ 394.35) | Engulfing | Sell |
| 011 09 Nov 2023 | Sell Price: 387.96 | Loss: Close Day2 ($ 394.35) | Dark Cloud Cover | Sell |
| 012 16 Oct 2023 | Buy Price: 401.16 | Profit: Close Day1 ($ 401.77) | Abandoned Baby | Buy |
| 013 14 Sep 2023 | Sell Price: 413.34 | Profit: Open Day1 ($ 411.86) | Engulfing | Sell |
| 014 12 Sep 2023 | Sell Price: 416.27 | Profit: Open Day1 ($ 416.17) | Abandoned Baby | Sell |
| 015 30 May 2023 | Sell Price: 367.50 | Profit: Open Day1 ($ 365.00) | Engulfing | Sell |
| 016One Year Average | Both Sides Result for 15 Signals |
Loss: $ -4.74 ($ -0.32 / Signal) |
All of Them | Buy + Sell |
| Simple Moving Averages (SMA) Period | Value $ | Signal | Exponential Moving Averages (EMA) Period | Value $ | Signal | |
|---|---|---|---|---|---|---|
| 2 | 459.76 | SELL | 2 | 458.83 | SELL | |
| 3 | 460.54 | SELL | 3 | 459.56 | SELL | |
| 5 | 461.39 | SELL | 5 | 460.04 | SELL | |
| 8 | 459.22 | SELL | 8 | 460.62 | SELL | |
| 13 | 460.56 | SELL | 13 | 462.24 | SELL | |
| 21 | 466.17 | SELL | 21 | 464.63 | SELL | |
| 34 | 471.38 | SELL | 34 | 465.91 | SELL | |
| 55 | 470.14 | SELL | 55 | 463.26 | SELL | |
| 90 | 456.32 | BUY | 90 | 454.89 | BUY | |
| 200 | 425.56 | BUY | 200 | 431.03 | BUY |
Mastercard Inc - A
IPO: 2006-05-25
Ticker: MAIndices: S&P 500,
Exchange: New York Stock Exchange, Inc. (US - USD)
Website: https://investor.mastercard.com/investor-relations/default.aspx
Phone:
Common Stock
Trade & Services (
Services-business Services, Nec
 Click to Enlarge