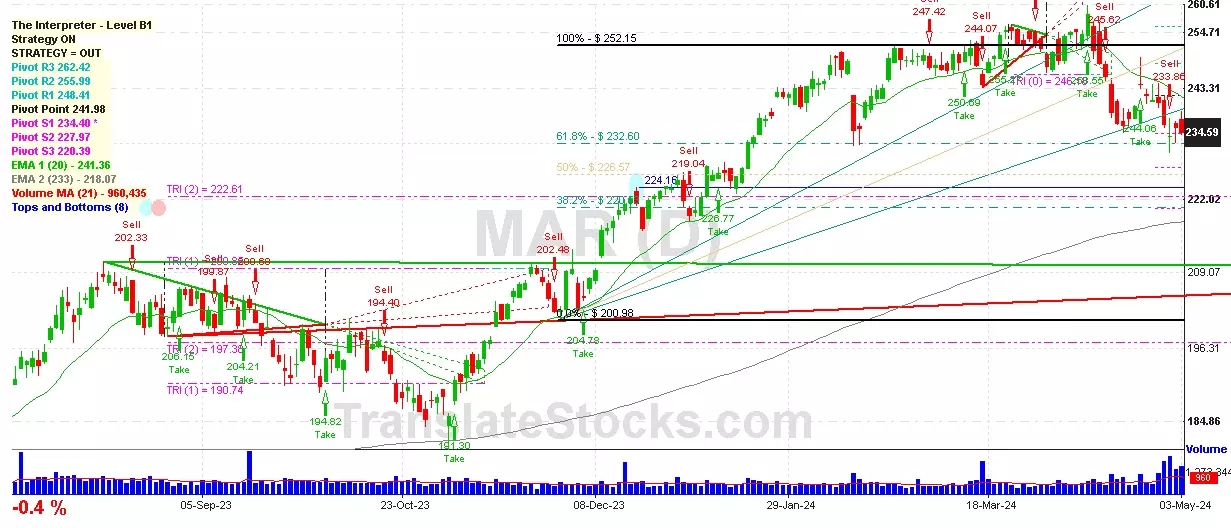
Hey Friend, I'm analysing MARRIOTT INTERNATIONAL CL A (MAR), and it is between the Support of $ 234.40 (PivotS1) and the Resistance of $ 241.98 (Pivot). The stock is also approaching the line of PivotS1 at $ 234.40, and if it goes below this line it could reach the next Support of 61.8% of Fibonacci at $ 232.60.

| Date | Price $ | Result % | Candle Name | Side |
|---|---|---|---|---|
| 001 18 Mar 2024 | Buy Price: 248.52 | Profit: Open Day1 ($ 249.36) | Abandoned Baby | Buy |
| 002 16 Jan 2024 | Buy Price: 226.34 | Profit: Close Day1 ($ 227.70) | Piercing Line | Buy |
| 003 03 Nov 2023 | Buy Price: 191.30 | Profit: Open Day1 ($ 192.29) | Abandoned Baby | Buy |
| 004 16 Aug 2023 | Buy Price: 206.48 | Profit: Open Day1 ($ 207.71) | Engulfing | Buy |
| 005 12 Jul 2023 | Sell Price: 190.01 | Profit: Close Day2 ($ 189.39) | Engulfing | Sell |
| 006 21 Jun 2023 | Buy Price: 176.12 | Profit: Open Day1 ($ 176.26) | Engulfing | Buy |
| 007 08 Jun 2023 | Buy Price: 178.48 | Profit: Open Day1 ($ 178.71) | Piercing Line | Buy |
| 008 30 May 2023 | Sell Price: 169.09 | Profit: Close Day1 ($ 167.79) | Engulfing | Sell |
| 009One Year Average | Both Sides Result for 8 Signals |
Profit: $ 6.71 ($ 0.84 / Signal) |
All of Them | Buy + Sell |
| Simple Moving Averages (SMA) Period | Value $ | Signal | Exponential Moving Averages (EMA) Period | Value $ | Signal | |
|---|---|---|---|---|---|---|
| 2 | 235.08 | SELL | 2 | 234.87 | SELL | |
| 3 | 234.67 | SELL | 3 | 235.23 | SELL | |
| 5 | 236.13 | SELL | 5 | 236.11 | SELL | |
| 8 | 238.43 | SELL | 8 | 237.35 | SELL | |
| 13 | 238.10 | SELL | 13 | 239.26 | SELL | |
| 21 | 243.66 | SELL | 21 | 241.59 | SELL | |
| 34 | 246.72 | SELL | 34 | 243.36 | SELL | |
| 55 | 247.04 | SELL | 55 | 242.86 | SELL | |
| 90 | 242.06 | SELL | 90 | 238.38 | SELL | |
| 200 | 219.56 | BUY | 200 | 222.13 | BUY |
Marriott International -cl A
IPO: 1998-03-23
Ticker: MARIndices: S&P 500,
Nasdaq 100,
Exchange: Nasdaq Nms - Global Market (US - USD)
Website: https://www.marriott.com/
Phone:
Common Stock
Real Estate & Construction (
Hotels & Motels
 Click to Enlarge