| Date | Price $ | Result % | Candle Name | Side |
|---|---|---|---|---|
| 001 25 Apr 2024 | Buy Price: 69.87 | Profit: Open Day2 ($ 69.98) | Piercing Line | Buy |
| 002 14 Feb 2024 | Buy Price: 73.47 | Profit: Open Day1 ($ 74.12) | Abandoned Baby | Buy |
| 003 23 Jan 2024 | Sell Price: 67.03 | Profit: Close Day1 ($ 65.47) | Abandoned Baby | Sell |
| 004 16 Oct 2023 | Buy Price: 52.52 | Profit: Close Day1 ($ 52.55) | Abandoned Baby | Buy |
| 005 27 Sep 2023 | Buy Price: 53.21 | Profit: Open Day1 ($ 53.29) | Abandoned Baby | Buy |
| 006 11 Sep 2023 | Buy Price: 56.64 | Loss: Close Day2 ($ 55.48) | Abandoned Baby | Buy |
| 007 05 Sep 2023 | Sell Price: 57.28 | Profit: Open Day1 ($ 57.13) | Abandoned Baby | Sell |
| 008 20 Jun 2023 | Buy Price: 56.01 | Profit: Close Day1 ($ 56.17) | Piercing Line | Buy |
| 009 30 May 2023 | Sell Price: 49.99 | Profit: Open Day1 ($ 49.84) | Engulfing | Sell |
| 010 26 May 2023 | Buy Price: 50.77 | Profit: Open Day1 ($ 50.84) | Abandoned Baby | Buy |
| 011One Year Average | Both Sides Result for 10 Signals |
Profit: $ 1.80 ($ 0.18 / Signal) |
All of Them | Buy + Sell |
| Simple Moving Averages (SMA) Period | Value $ | Signal | Exponential Moving Averages (EMA) Period | Value $ | Signal | |
|---|---|---|---|---|---|---|
| 2 | 68.78 | BUY | 2 | 68.89 | BUY | |
| 3 | 68.67 | BUY | 3 | 68.96 | BUY | |
| 5 | 69.19 | SELL | 5 | 69.25 | SELL | |
| 8 | 69.82 | SELL | 8 | 69.80 | SELL | |
| 13 | 70.74 | SELL | 13 | 70.69 | SELL | |
| 21 | 72.43 | SELL | 21 | 71.79 | SELL | |
| 34 | 74.06 | SELL | 34 | 72.65 | SELL | |
| 55 | 74.59 | SELL | 55 | 72.56 | SELL | |
| 90 | 72.05 | SELL | 90 | 70.99 | SELL | |
| 200 | 64.00 | BUY | 200 | 65.90 | BUY |
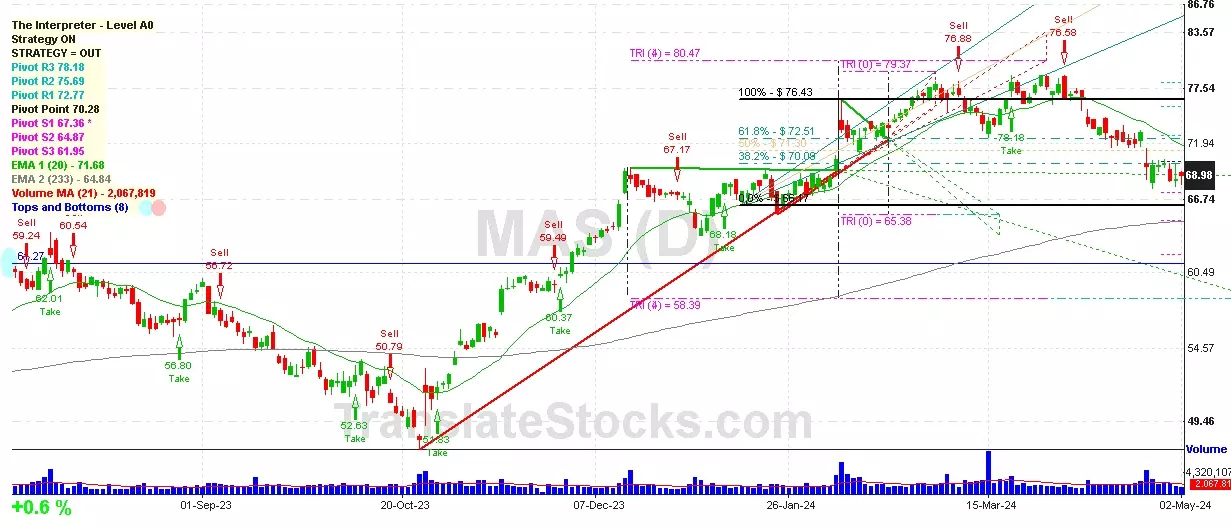
Masco Corp
IPO: 1969-05-05
Ticker: MASIndices: S&P 500,
Exchange: New York Stock Exchange, Inc. (US - USD)
Website: https://masco.com/
Phone:
Common Stock
Manufacturing (
Heating Equip, Except Elec & Warm Air; & Plumbing Fixtures

 Click to Enlarge