| Date | Price $ | Result % | Candle Name | Side |
|---|---|---|---|---|
| 001 22 Apr 2024 | Buy Price: 53.60 | Profit: Close Day1 ($ 53.73) | Abandoned Baby | Buy |
| 002 01 Mar 2024 | Sell Price: 58.79 | Profit: Close Day1 ($ 58.50) | Abandoned Baby | Sell |
| 003 29 Nov 2023 | Sell Price: 54.70 | Loss: Close Day2 ($ 55.22) | Engulfing | Sell |
| 004 29 Nov 2023 | Sell Price: 54.71 | Loss: Close Day2 ($ 55.22) | Dark Cloud Cover | Sell |
| 005 28 Nov 2023 | Buy Price: 55.28 | Profit: Open Day1 ($ 55.48) | Engulfing | Buy |
| 006 24 Nov 2023 | Sell Price: 55.17 | Profit: Close Day1 ($ 54.72) | Abandoned Baby | Sell |
| 007 15 Sep 2023 | Sell Price: 56.14 | Profit: Open Day2 ($ 56.02) | Engulfing | Sell |
| 008 18 May 2023 | Buy Price: 59.85 | Profit: Open Day1 ($ 60.24) | Engulfing | Buy |
| 009 18 May 2023 | Buy Price: 59.80 | Profit: Open Day1 ($ 60.24) | Piercing Line | Buy |
| 010One Year Average | Both Sides Result for 9 Signals |
Profit: $ 0.98 ($ 0.11 / Signal) |
All of Them | Buy + Sell |
| Simple Moving Averages (SMA) Period | Value $ | Signal | Exponential Moving Averages (EMA) Period | Value $ | Signal | |
|---|---|---|---|---|---|---|
| 2 | 53.47 | SELL | 2 | 53.45 | SELL | |
| 3 | 53.46 | SELL | 3 | 53.49 | SELL | |
| 5 | 53.58 | SELL | 5 | 53.54 | SELL | |
| 8 | 53.64 | SELL | 8 | 53.65 | SELL | |
| 13 | 53.71 | SELL | 13 | 53.94 | SELL | |
| 21 | 54.28 | SELL | 21 | 54.53 | SELL | |
| 34 | 56.14 | SELL | 34 | 55.25 | SELL | |
| 55 | 56.65 | SELL | 55 | 55.80 | SELL | |
| 90 | 56.69 | SELL | 90 | 56.10 | SELL | |
| 200 | 55.71 | SELL | 200 | 58.56 | SELL |
Monster Beverage Corp
IPO: 1985-12-09
Ticker: MNSTIndices: S&P 500,
Nasdaq 100,
Exchange: Nasdaq Nms - Global Market (US - USD)
Website: http://monsterbevcorp.com/
Phone:
Common Stock
Manufacturing (
Bottled & Canned Soft Drinks & Carbonated Waters

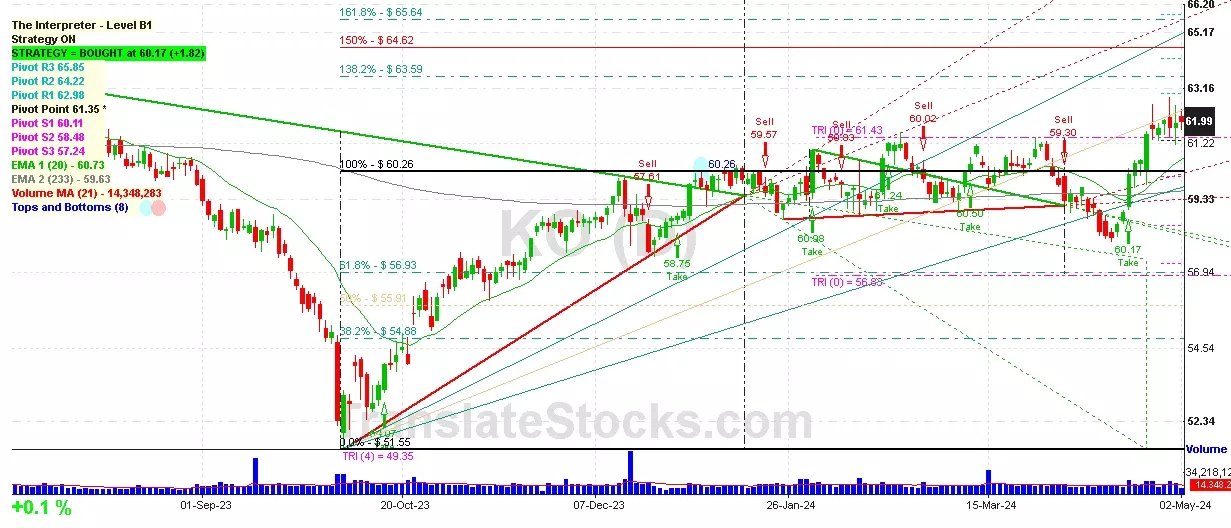
 Click to Enlarge
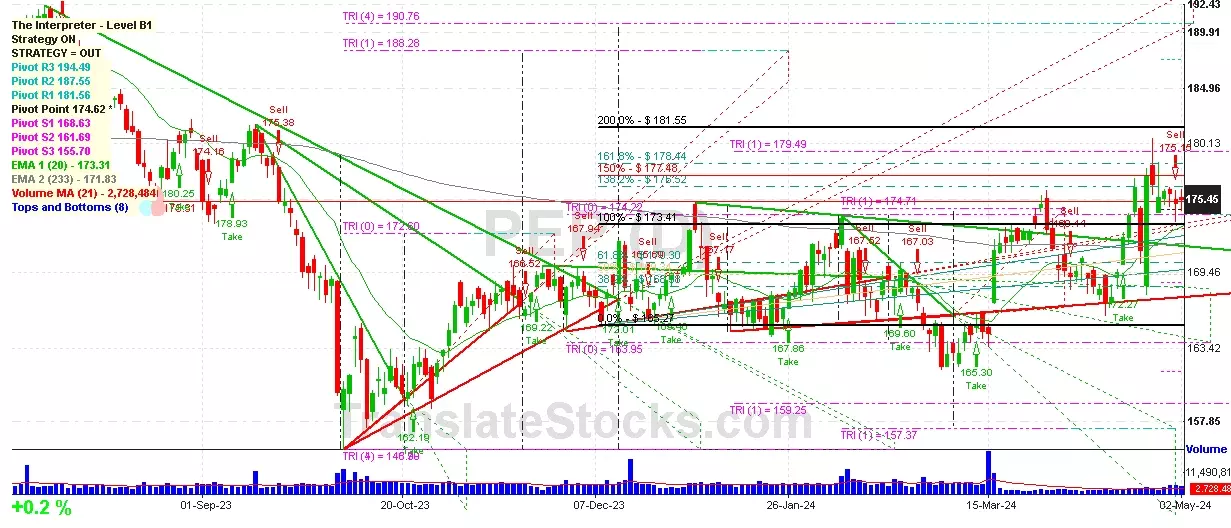