| Date | Price $ | Result % | Candle Name | Side |
|---|---|---|---|---|
| 001 14 Feb 2024 | Buy Price: 40.40 | Profit: Open Day1 ($ 40.56) | Engulfing | Buy |
| 002 05 Jan 2024 | Sell Price: 41.49 | Loss: Close Day2 ($ 41.86) | Dark Cloud Cover | Sell |
| 003 13 Sep 2023 | Sell Price: 44.75 | Profit: Open Day1 ($ 43.82) | Dark Cloud Cover | Sell |
| 004 26 Jul 2023 | Buy Price: 45.56 | Profit: Open Day1 ($ 45.66) | Engulfing | Buy |
| 005 31 May 2023 | Buy Price: 44.42 | Profit: Open Day1 ($ 44.63) | Piercing Line | Buy |
| 006 22 May 2023 | Sell Price: 44.93 | Loss: Close Day2 ($ 44.95) | Engulfing | Sell |
| 007 19 May 2023 | Buy Price: 45.30 | Profit: Open Day1 ($ 45.31) | Abandoned Baby | Buy |
| 008 15 May 2023 | Sell Price: 45.48 | Profit: Open Day1 ($ 45.40) | Engulfing | Sell |
| 009 15 May 2023 | Sell Price: 45.56 | Profit: Open Day1 ($ 45.40) | Dark Cloud Cover | Sell |
| 010One Year Average | Both Sides Result for 9 Signals |
Profit: $ 1.26 ($ 0.14 / Signal) |
All of Them | Buy + Sell |
| Simple Moving Averages (SMA) Period | Value $ | Signal | Exponential Moving Averages (EMA) Period | Value $ | Signal | |
|---|---|---|---|---|---|---|
| 2 | 43.60 | BUY | 2 | 43.67 | BUY | |
| 3 | 43.58 | BUY | 3 | 43.54 | BUY | |
| 5 | 43.31 | BUY | 5 | 43.27 | BUY | |
| 8 | 42.81 | BUY | 8 | 42.94 | BUY | |
| 13 | 42.14 | BUY | 13 | 42.65 | BUY | |
| 21 | 42.14 | BUY | 21 | 42.49 | BUY | |
| 34 | 42.80 | BUY | 34 | 42.34 | BUY | |
| 55 | 42.02 | BUY | 55 | 42.13 | BUY | |
| 90 | 41.54 | BUY | 90 | 41.99 | BUY | |
| 200 | 42.19 | BUY | 200 | 42.43 | BUY |
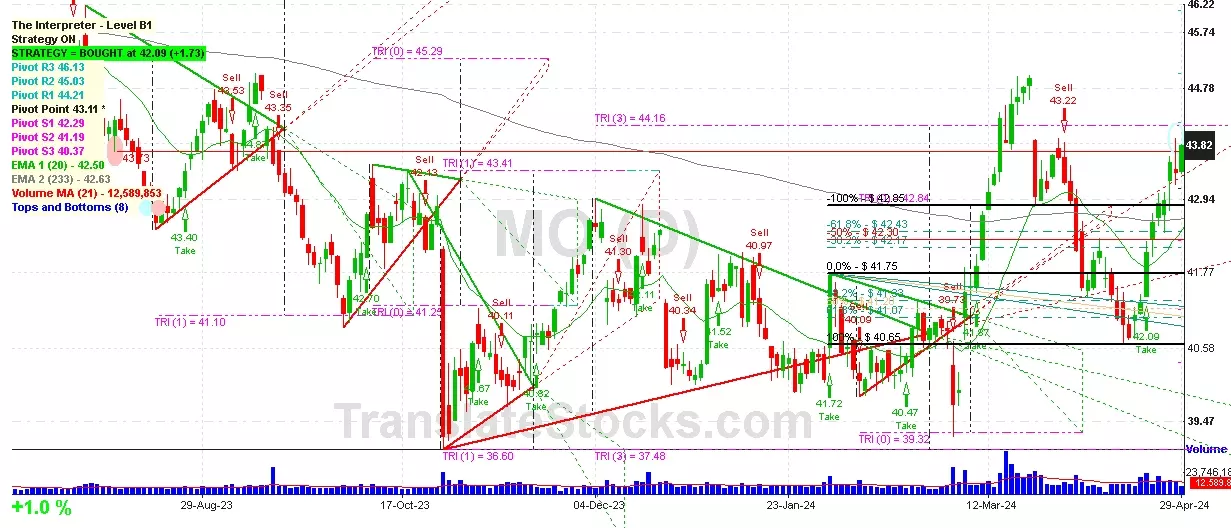
Altria Group Inc
IPO: 1923-03-15
Ticker: MOIndices: S&P 500,
Exchange: New York Stock Exchange, Inc. (US - USD)
Website: https://www.altria.com/
Phone:
Common Stock
Manufacturing (
Cigarettes

 Click to Enlarge