| Date | Price $ | Result % | Candle Name | Side |
|---|---|---|---|---|
| 001 24 Apr 2024 | Sell Price: 7,798.28 | Profit: Open Day1 ($ 7,726.12) | Abandoned Baby | Sell |
| 002 12 Mar 2024 | Buy Price: 7,744.15 | Profit: Close Day1 ($ 7,746.30) | Abandoned Baby | Buy |
| 003 12 Mar 2024 | Buy Price: 7,723.00 | Profit: Open Day1 ($ 7,723.87) | Engulfing | Buy |
| 004 20 Feb 2024 | Buy Price: 7,420.02 | Profit: Open Day1 ($ 7,486.64) | Piercing Line | Buy |
| 005 25 Jan 2024 | Buy Price: 7,019.11 | Profit: Close Day1 ($ 7,035.81) | Engulfing | Buy |
| 006 18 Jan 2024 | Buy Price: 7,184.96 | Profit: Open Day1 ($ 7,192.75) | Abandoned Baby | Buy |
| 007 28 Dec 2023 | Sell Price: 6,981.71 | Profit: Open Day2 ($ 6,901.21) | Abandoned Baby | Sell |
| 008 26 Oct 2023 | Buy Price: 5,426.82 | Profit: Open Day2 ($ 5,427.00) | Abandoned Baby | Buy |
| 009 20 Sep 2023 | Sell Price: 6,132.13 | Profit: Open Day1 ($ 6,059.65) | Engulfing | Sell |
| 010 20 Sep 2023 | Sell Price: 6,133.51 | Profit: Open Day1 ($ 6,059.65) | Dark Cloud Cover | Sell |
| 011 27 Jul 2023 | Sell Price: 6,301.71 | Loss: Close Day2 ($ 6,306.44) | Abandoned Baby | Sell |
| 012 10 Jul 2023 | Buy Price: 6,213.80 | Profit: Open Day1 ($ 6,252.01) | Abandoned Baby | Buy |
| 013 05 Jun 2023 | Sell Price: 5,661.56 | Loss: Close Day2 ($ 5,771.12) | Dark Cloud Cover | Sell |
| 014 26 May 2023 | Sell Price: 5,617.56 | Profit: Open Day2 ($ 5,603.68) | Dark Cloud Cover | Sell |
| 015 18 May 2023 | Buy Price: 5,883.17 | Loss: Close Day2 ($ 5,705.32) | Engulfing | Buy |
| 016 18 May 2023 | Buy Price: 5,874.13 | Loss: Close Day2 ($ 5,705.32) | Piercing Line | Buy |
| 017 15 May 2023 | Buy Price: 5,898.82 | Loss: Close Day2 ($ 5,833.16) | Engulfing | Buy |
| 018 10 May 2023 | Sell Price: 5,828.80 | Profit: Open Day1 ($ 5,819.23) | Engulfing | Sell |
| 019 10 May 2023 | Sell Price: 5,836.51 | Profit: Open Day1 ($ 5,819.23) | Dark Cloud Cover | Sell |
| 020One Year Average | Both Sides Result for 19 Signals |
Loss: $ -54.36 ($ -2.86 / Signal) |
All of Them | Buy + Sell |
| Simple Moving Averages (SMA) Period | Value $ | Signal | Exponential Moving Averages (EMA) Period | Value $ | Signal | |
|---|---|---|---|---|---|---|
| 2 | 7,686.02 | SELL | 2 | 7,681.69 | SELL | |
| 3 | 7,723.44 | SELL | 3 | 7,703.57 | SELL | |
| 5 | 7,762.44 | SELL | 5 | 7,723.53 | SELL | |
| 8 | 7,733.68 | SELL | 8 | 7,737.21 | SELL | |
| 13 | 7,732.40 | SELL | 13 | 7,754.16 | SELL | |
| 21 | 7,807.45 | SELL | 21 | 7,764.43 | SELL | |
| 34 | 7,802.45 | SELL | 34 | 7,737.53 | SELL | |
| 55 | 7,706.38 | SELL | 55 | 7,632.57 | BUY | |
| 90 | 7,461.75 | BUY | 90 | 7,417.23 | BUY | |
| 200 | 6,727.02 | BUY | 200 | 6,858.34 | BUY |
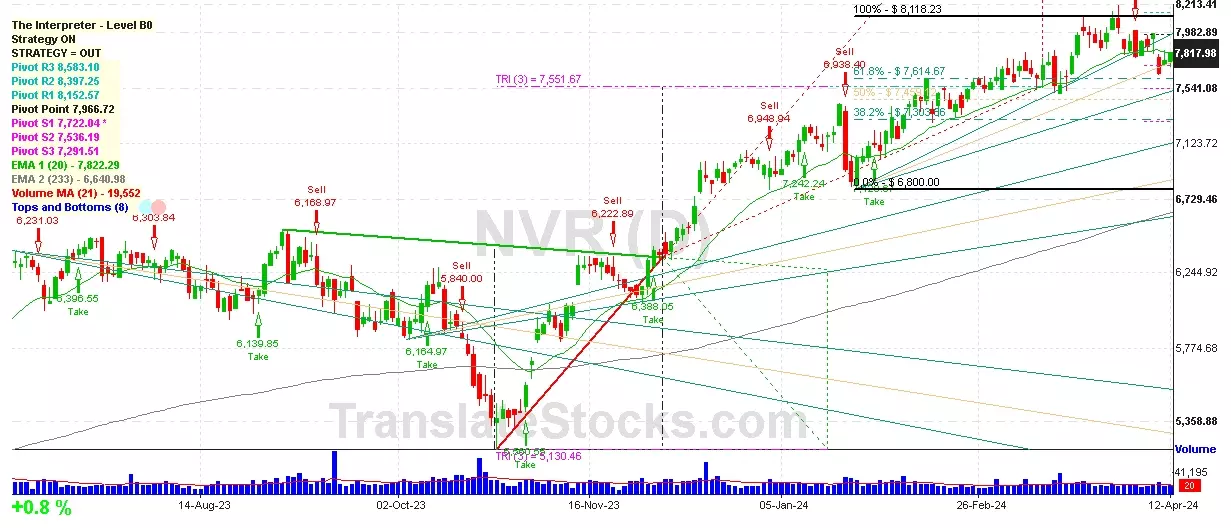
Nvr Inc
IPO: 2008-01-02
Ticker: NVRIndices: S&P 500,
Exchange: New York Stock Exchange, Inc. (US - USD)
Website: http://www.nvrinc.com/
Phone:
Common Stock
Real Estate & Construction (
Operative Builders

 Click to Enlarge