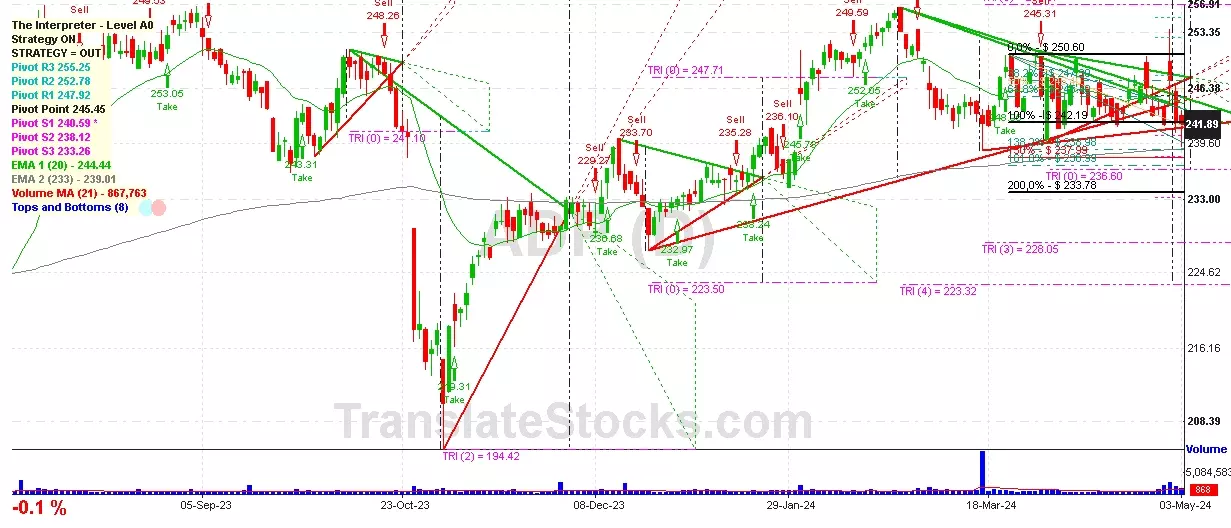
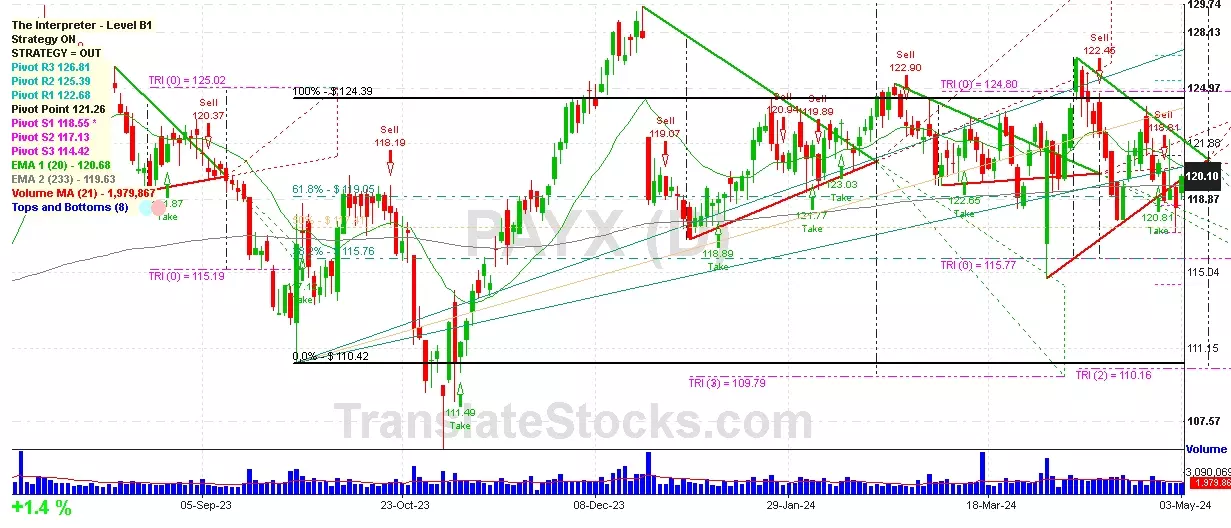
Hey Friend, I'm analysing PAYCHEX INC (PAYX), and it is between the Support of $ 119.05 (61.8% of Fibonacci) and the Resistance of $ 121.26 (Pivot). The stock is also approaching the line of Pivot at $ 121.26, and if it goes above this line it could reach the next Resistance of 100% of Fibonacci at $ 124.39.

| Date | Price $ | Result % | Candle Name | Side |
|---|---|---|---|---|
| 001 01 Apr 2024 | Sell Price: 121.62 | Profit: Open Day1 ($ 116.57) | Engulfing | Sell |
| 002 04 Mar 2024 | Buy Price: 122.34 | Profit: Open Day1 ($ 122.38) | Abandoned Baby | Buy |
| 003 29 Jan 2024 | Buy Price: 121.36 | Profit: Close Day1 ($ 122.42) | Engulfing | Buy |
| 004 24 Jan 2024 | Sell Price: 121.89 | Profit: Open Day1 ($ 121.84) | Engulfing | Sell |
| 005 14 Dec 2023 | Sell Price: 126.83 | Profit: Open Day1 ($ 126.54) | Engulfing | Sell |
| 006 27 Nov 2023 | Buy Price: 118.95 | Profit: Open Day1 ($ 119.14) | Piercing Line | Buy |
| 007 13 Nov 2023 | Sell Price: 114.48 | Loss: Close Day2 ($ 117.14) | Abandoned Baby | Sell |
| 008 25 Sep 2023 | Buy Price: 114.35 | Profit: Close Day2 ($ 116.51) | Abandoned Baby | Buy |
| 009 04 Aug 2023 | Sell Price: 122.99 | Loss: Close Day2 ($ 123.90) | Engulfing | Sell |
| 010 28 Jun 2023 | Sell Price: 110.63 | Profit: Close Day1 ($ 109.33) | Abandoned Baby | Sell |
| 011 28 Jun 2023 | Sell Price: 110.71 | Profit: Close Day1 ($ 109.33) | Engulfing | Sell |
| 012 26 May 2023 | Buy Price: 108.17 | Profit: Open Day1 ($ 108.55) | Abandoned Baby | Buy |
| 013One Year Average | Both Sides Result for 12 Signals |
Profit: $ 8.33 ($ 0.69 / Signal) |
All of Them | Buy + Sell |
| Simple Moving Averages (SMA) Period | Value $ | Signal | Exponential Moving Averages (EMA) Period | Value $ | Signal | |
|---|---|---|---|---|---|---|
| 2 | 119.28 | BUY | 2 | 119.66 | BUY | |
| 3 | 119.32 | BUY | 3 | 119.57 | BUY | |
| 5 | 119.52 | BUY | 5 | 119.67 | BUY | |
| 8 | 120.26 | SELL | 8 | 119.94 | BUY | |
| 13 | 120.10 | SELL | 13 | 120.32 | SELL | |
| 21 | 121.41 | SELL | 21 | 120.72 | SELL | |
| 34 | 121.30 | SELL | 34 | 121.06 | SELL | |
| 55 | 121.72 | SELL | 55 | 121.23 | SELL | |
| 90 | 121.27 | SELL | 90 | 121.05 | SELL | |
| 200 | 120.40 | SELL | 200 | 119.86 | BUY |
Paychex Inc
IPO: 2005-06-05
Ticker: PAYXIndices: S&P 500,
Nasdaq 100,
Exchange: Nasdaq Nms - Global Market (US - USD)
Website: http://www.paychex.com
Phone:
Common Stock
Trade & Services (
Services-engineering, Accounting, Research, Management
 Click to Enlarge