| Date | Price $ | Result % | Candle Name | Side |
|---|---|---|---|---|
| 001 08 Apr 2024 | Buy Price: 33.37 | Profit: Open Day1 ($ 33.40) | Abandoned Baby | Buy |
| 002 13 Feb 2024 | Sell Price: 35.70 | Loss: Close Day2 ($ 36.56) | Abandoned Baby | Sell |
| 003 02 Jan 2024 | Buy Price: 36.83 | Loss: Close Day2 ($ 36.25) | Engulfing | Buy |
| 004 08 Nov 2023 | Buy Price: 33.58 | Profit: Open Day1 ($ 33.62) | Abandoned Baby | Buy |
| 005 08 Nov 2023 | Buy Price: 33.53 | Profit: Open Day1 ($ 33.62) | Engulfing | Buy |
| 006 09 Oct 2023 | Buy Price: 30.46 | Profit: Open Day1 ($ 30.68) | Piercing Line | Buy |
| 007 05 Sep 2023 | Sell Price: 36.24 | Profit: Open Day1 ($ 36.06) | Abandoned Baby | Sell |
| 008 28 Jun 2023 | Sell Price: 38.65 | Profit: Open Day1 ($ 38.37) | Engulfing | Sell |
| 009 14 Jun 2023 | Sell Price: 39.14 | Loss: Close Day2 ($ 40.43) | Engulfing | Sell |
| 010 14 Jun 2023 | Sell Price: 39.13 | Loss: Close Day2 ($ 40.43) | Dark Cloud Cover | Sell |
| 011 12 Jun 2023 | Buy Price: 38.88 | Profit: Open Day1 ($ 39.00) | Piercing Line | Buy |
| 012 22 May 2023 | Sell Price: 42.26 | Profit: Open Day1 ($ 42.05) | Abandoned Baby | Sell |
| 013One Year Average | Both Sides Result for 12 Signals |
Loss: $ -2.86 ($ -0.24 / Signal) |
All of Them | Buy + Sell |
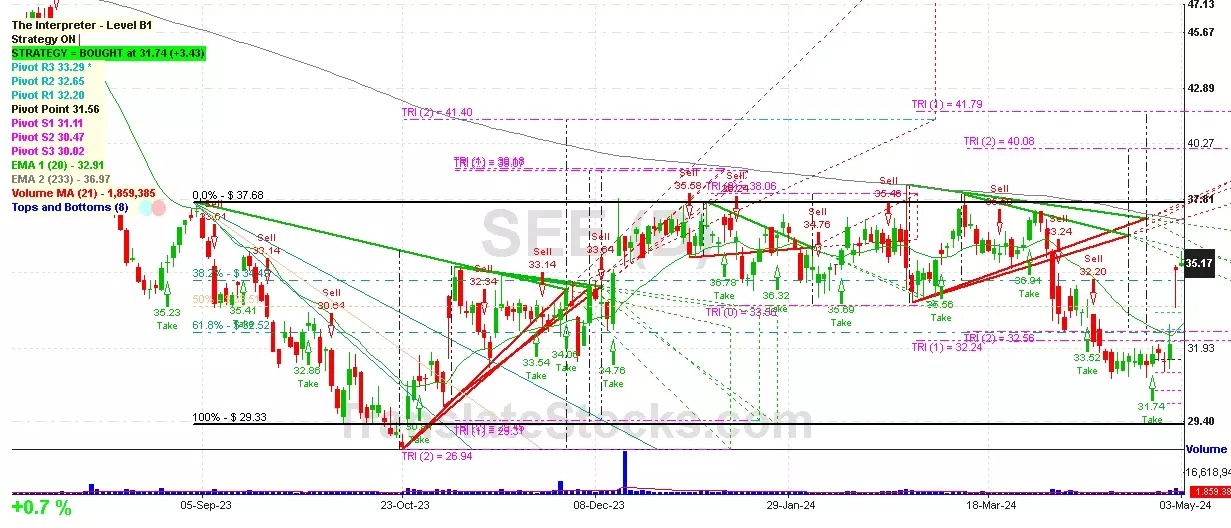
| Simple Moving Averages (SMA) Period | Value $ | Signal | Exponential Moving Averages (EMA) Period | Value $ | Signal | |
|---|---|---|---|---|---|---|
| 2 | 35.05 | BUY | 2 | 34.76 | BUY | |
| 3 | 34.07 | BUY | 3 | 34.28 | BUY | |
| 5 | 33.10 | BUY | 5 | 33.61 | BUY | |
| 8 | 32.54 | BUY | 8 | 33.08 | BUY | |
| 13 | 32.12 | BUY | 13 | 32.81 | BUY | |
| 21 | 32.40 | BUY | 21 | 32.94 | BUY | |
| 34 | 33.65 | BUY | 34 | 33.38 | BUY | |
| 55 | 34.49 | BUY | 55 | 33.90 | BUY | |
| 90 | 35.04 | BUY | 90 | 34.36 | BUY | |
| 200 | 34.97 | BUY | 200 | 36.21 | SELL |
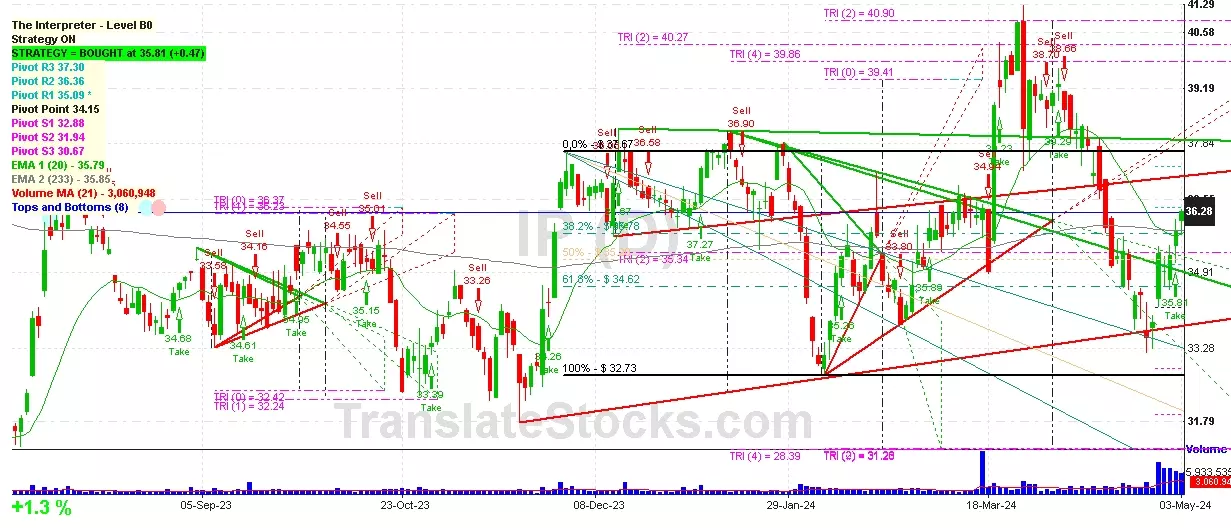
Sealed Air Corp
IPO: 1979-05-31
Ticker: SEEIndices: S&P 500,
Exchange: New York Stock Exchange, Inc. (US - USD)
Website: https://sealedair.com/
Phone:
Common Stock
Life Sciences (
Plastic Material, Synth Resin/rubber, Cellulos (no Glass)
 Click to Enlarge