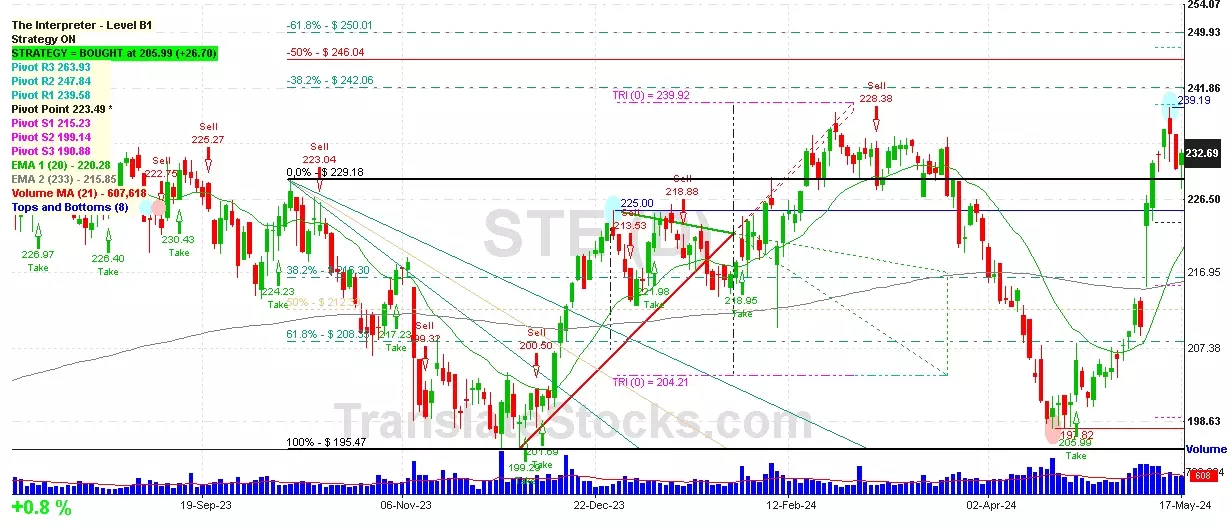
Hey Friend, I'm analysing STERIS PLC (STE), and it is between the Support of $ 229.18 (0% of Fibonacci) and the Resistance of $ 239.58 (PivotR1). The stock is also approaching the line of PivotR1 at $ 239.58, and if it goes above this line it could reach the next Resistance of Triangle projection at $239.92.

| Date | Price $ | Result % | Candle Name | Side |
|---|---|---|---|---|
| 001 08 May 2024 | Sell Price: 210.09 | Loss: Close Day2 ($ 231.33) | Engulfing | Sell |
| 002 08 May 2024 | Sell Price: 209.74 | Loss: Close Day2 ($ 231.33) | Dark Cloud Cover | Sell |
| 003 09 Apr 2024 | Buy Price: 214.72 | Loss: Close Day2 ($ 206.28) | Abandoned Baby | Buy |
| 004 08 Dec 2023 | Sell Price: 200.50 | Loss: Close Day2 ($ 201.58) | Dark Cloud Cover | Sell |
| 005 06 Dec 2023 | Buy Price: 199.29 | Profit: Open Day1 ($ 200.08) | Abandoned Baby | Buy |
| 006 30 Nov 2023 | Buy Price: 200.94 | Profit: Close Day1 ($ 203.51) | Engulfing | Buy |
| 007 15 Nov 2023 | Sell Price: 203.53 | Profit: Close Day1 ($ 203.42) | Abandoned Baby | Sell |
| 008 19 Jul 2023 | Buy Price: 227.44 | Profit: Open Day1 ($ 228.96) | Engulfing | Buy |
| 009 19 Jul 2023 | Buy Price: 227.48 | Profit: Open Day1 ($ 228.96) | Piercing Line | Buy |
| 010One Year Average | Both Sides Result for 9 Signals |
Loss: $ -45.88 ($ -5.10 / Signal) |
All of Them | Buy + Sell |
| Simple Moving Averages (SMA) Period | Value $ | Signal | Exponential Moving Averages (EMA) Period | Value $ | Signal | |
|---|---|---|---|---|---|---|
| 2 | 231.71 | BUY | 2 | 232.52 | BUY | |
| 3 | 232.96 | SELL | 3 | 232.50 | BUY | |
| 5 | 233.49 | SELL | 5 | 231.36 | BUY | |
| 8 | 229.36 | BUY | 8 | 228.43 | BUY | |
| 13 | 221.26 | BUY | 13 | 223.98 | BUY | |
| 21 | 214.33 | BUY | 21 | 219.95 | BUY | |
| 34 | 212.03 | BUY | 34 | 218.00 | BUY | |
| 55 | 218.64 | BUY | 55 | 217.89 | BUY | |
| 90 | 220.93 | BUY | 90 | 218.14 | BUY | |
| 200 | 218.90 | BUY | 200 | 216.45 | BUY |
Steris Plc
IPO: 2015-11-03
Ticker: STEIndices: S&P 500,
Exchange: New York Stock Exchange, Inc. (IE - USD)
Website: https://www.steris.com/
Phone:
Common Stock
Life Sciences (
Orthopedic, Prosthetic & Surgical Appliances & Supplies
 Click to Enlarge