| Date | Price $ | Result % | Candle Name | Side |
|---|---|---|---|---|
| 001 12 Mar 2024 | Buy Price: 25.86 | Profit: Close Day1 ($ 26.01) | Piercing Line | Buy |
| 002 28 Dec 2023 | Buy Price: 29.39 | Loss: Close Day2 ($ 28.70) | Piercing Line | Buy |
| 003 30 Nov 2023 | Sell Price: 23.54 | Loss: Close Day2 ($ 27.76) | Engulfing | Sell |
| 004 14 Nov 2023 | Buy Price: 23.05 | Profit: Close Day1 ($ 23.33) | Abandoned Baby | Buy |
| 005 24 Oct 2023 | Buy Price: 20.27 | Loss: Close Day2 ($ 19.70) | Abandoned Baby | Buy |
| 006 02 Oct 2023 | Sell Price: 21.99 | Profit: Open Day1 ($ 21.73) | Abandoned Baby | Sell |
| 007 26 May 2023 | Buy Price: 13.33 | Profit: Open Day1 ($ 13.35) | Engulfing | Buy |
| 008One Year Average | Both Sides Result for 7 Signals |
Loss: $ -4.77 ($ -0.68 / Signal) |
All of Them | Buy + Sell |
| Simple Moving Averages (SMA) Period | Value $ | Signal | Exponential Moving Averages (EMA) Period | Value $ | Signal | |
|---|---|---|---|---|---|---|
| 2 | 26.33 | SELL | 2 | 26.36 | SELL | |
| 3 | 26.48 | SELL | 3 | 26.42 | SELL | |
| 5 | 26.65 | SELL | 5 | 26.47 | SELL | |
| 8 | 26.36 | SELL | 8 | 26.54 | SELL | |
| 13 | 26.62 | SELL | 13 | 26.69 | SELL | |
| 21 | 27.21 | SELL | 21 | 26.80 | SELL | |
| 34 | 26.95 | SELL | 34 | 26.82 | SELL | |
| 55 | 26.53 | SELL | 55 | 26.73 | SELL | |
| 90 | 27.08 | SELL | 90 | 26.34 | SELL | |
| 200 | 24.66 | BUY | 200 | 24.93 | BUY |
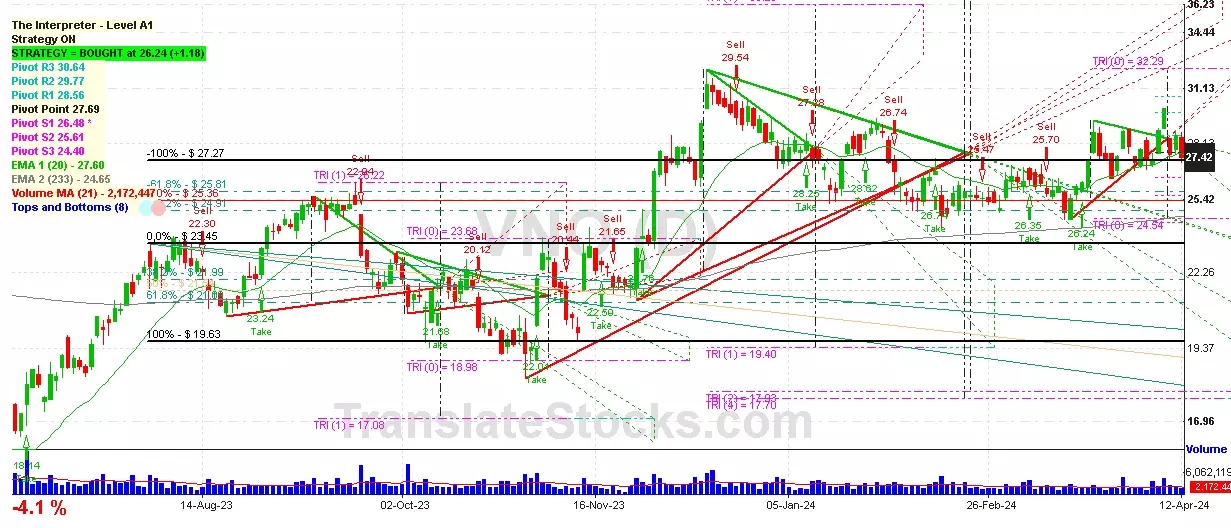
Vornado Realty Trust
IPO: 1962-01-31
Ticker: VNOIndices: S&P 500,
Exchange: New York Stock Exchange, Inc. (US - USD)
Website: http://www.vno.com
Phone:
REIT (Real Estate Investment Trust)
Real Estate & Construction (
Real Estate Investment Trusts

 Click to Enlarge