| Date | Price $ | Result % | Candle Name | Side |
|---|---|---|---|---|
| 001 22 Mar 2024 | Sell Price: 40.37 | Loss: Close Day2 ($ 40.85) | Dark Cloud Cover | Sell |
| 002 14 Mar 2024 | Sell Price: 39.77 | Profit: Open Day1 ($ 39.60) | Abandoned Baby | Sell |
| 003 01 Mar 2024 | Buy Price: 40.20 | Profit: Close Day1 ($ 40.31) | Engulfing | Buy |
| 004 02 Feb 2024 | Sell Price: 42.13 | Profit: Open Day1 ($ 42.00) | Abandoned Baby | Sell |
| 005 30 Jan 2024 | Buy Price: 42.47 | Profit: Open Day2 ($ 42.68) | Engulfing | Buy |
| 006 13 Nov 2023 | Buy Price: 35.82 | Profit: Open Day1 ($ 36.01) | Piercing Line | Buy |
| 007 06 Nov 2023 | Sell Price: 35.64 | Loss: Close Day2 ($ 35.77) | Abandoned Baby | Sell |
| 008 18 Aug 2023 | Buy Price: 33.18 | Profit: Close Day2 ($ 33.20) | Piercing Line | Buy |
| 009 20 Jun 2023 | Sell Price: 35.81 | Profit: Open Day1 ($ 35.70) | Abandoned Baby | Sell |
| 010One Year Average | Both Sides Result for 9 Signals |
Profit: $ 0.33 ($ 0.04 / Signal) |
All of Them | Buy + Sell |
| Simple Moving Averages (SMA) Period | Value $ | Signal | Exponential Moving Averages (EMA) Period | Value $ | Signal | |
|---|---|---|---|---|---|---|
| 2 | 39.45 | BUY | 2 | 39.56 | BUY | |
| 3 | 39.46 | BUY | 3 | 39.53 | BUY | |
| 5 | 39.34 | BUY | 5 | 39.55 | BUY | |
| 8 | 39.64 | BUY | 8 | 39.67 | BUY | |
| 13 | 39.80 | SELL | 13 | 39.91 | SELL | |
| 21 | 40.67 | SELL | 21 | 40.15 | SELL | |
| 34 | 40.53 | SELL | 34 | 40.29 | SELL | |
| 55 | 40.40 | SELL | 55 | 40.19 | SELL | |
| 90 | 40.11 | SELL | 90 | 39.66 | BUY | |
| 200 | 36.89 | BUY | 200 | 38.57 | BUY |
Verizon Communications Inc
IPO: 1984-02-15
Website: https://www.verizon.com/
Phone:
Common Stock
Technology (
Telephone Communications (no Radiotelephone)

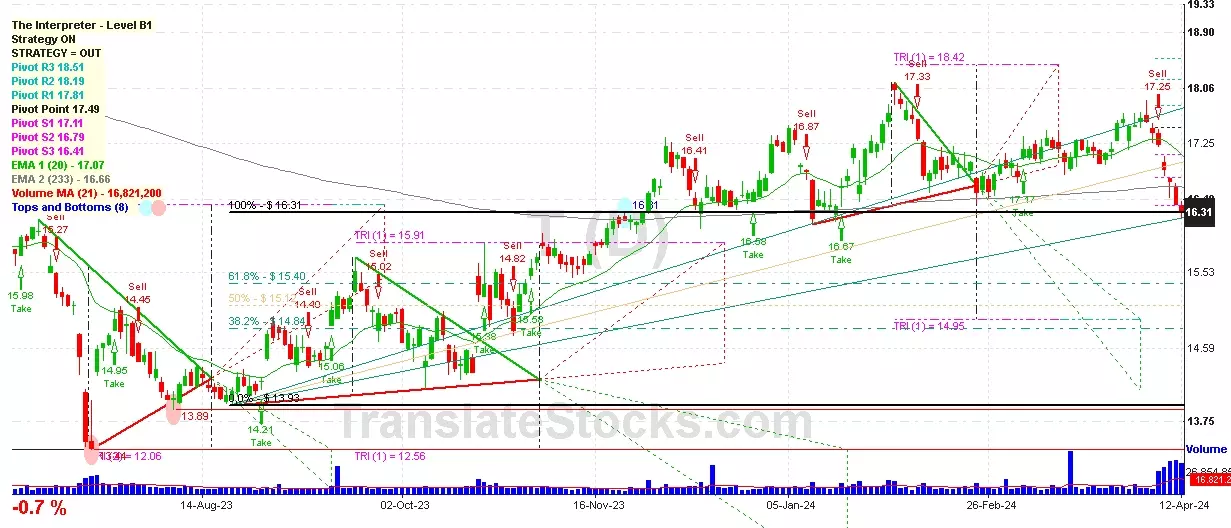
 Click to Enlarge
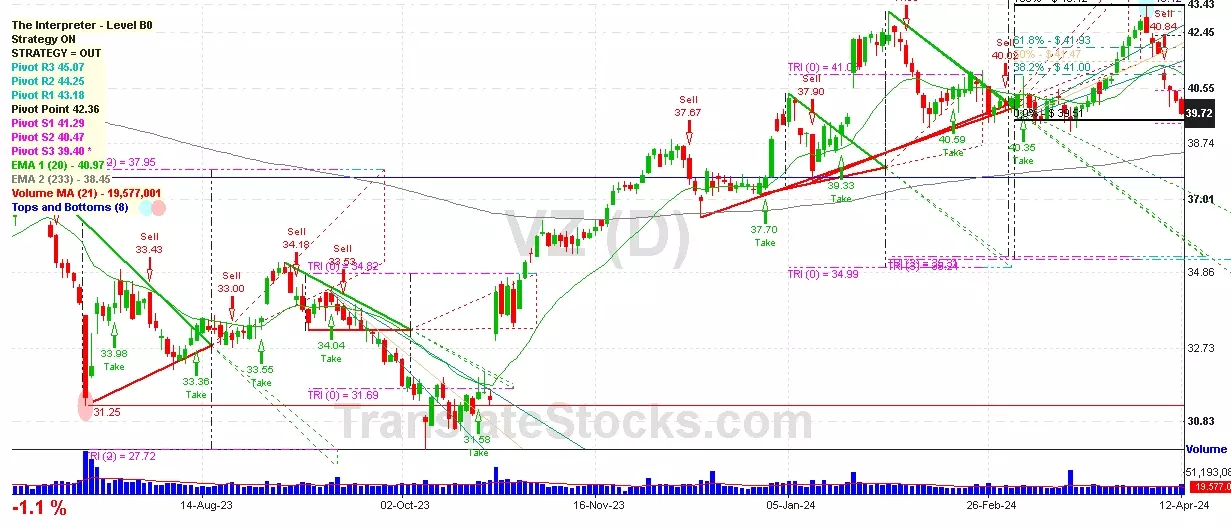