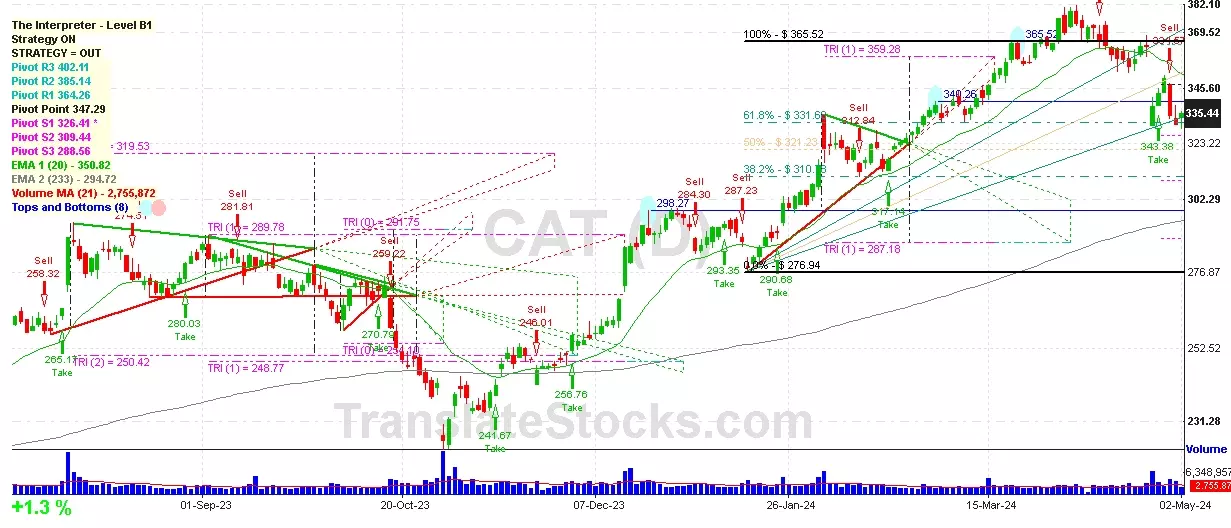
| Date | Price $ | Result % | Candle Name | Side |
|---|---|---|---|---|
| 001 04 Apr 2024 | Sell Price: 147.34 | Loss: Close Day2 ($ 149.46) | Dark Cloud Cover | Sell |
| 002 26 Mar 2024 | Buy Price: 143.91 | Profit: Open Day1 ($ 144.77) | Engulfing | Buy |
| 003 26 Mar 2024 | Buy Price: 143.85 | Profit: Open Day1 ($ 144.77) | Piercing Line | Buy |
| 004 13 Feb 2024 | Sell Price: 136.40 | Profit: Open Day1 ($ 134.00) | Abandoned Baby | Sell |
| 005 15 Nov 2023 | Sell Price: 114.88 | Profit: Open Day1 ($ 114.74) | Dark Cloud Cover | Sell |
| 006 06 Nov 2023 | Sell Price: 110.27 | Profit: Open Day1 ($ 109.61) | Engulfing | Sell |
| 007 29 Sep 2023 | Sell Price: 106.38 | Profit: Open Day1 ($ 105.83) | Abandoned Baby | Sell |
| 008 29 Sep 2023 | Sell Price: 106.27 | Profit: Open Day1 ($ 105.83) | Engulfing | Sell |
| 009 05 Sep 2023 | Sell Price: 109.47 | Profit: Open Day1 ($ 109.17) | Abandoned Baby | Sell |
| 010 21 Aug 2023 | Buy Price: 111.43 | Profit: Close Day2 ($ 112.23) | Abandoned Baby | Buy |
| 011 11 Aug 2023 | Buy Price: 114.19 | Loss: Close Day2 ($ 112.58) | Piercing Line | Buy |
| 012 26 May 2023 | Buy Price: 94.74 | Loss: Close Day2 ($ 92.63) | Abandoned Baby | Buy |
| 013One Year Average | Both Sides Result for 12 Signals |
Profit: $ 1.24 ($ 0.10 / Signal) |
All of Them | Buy + Sell |
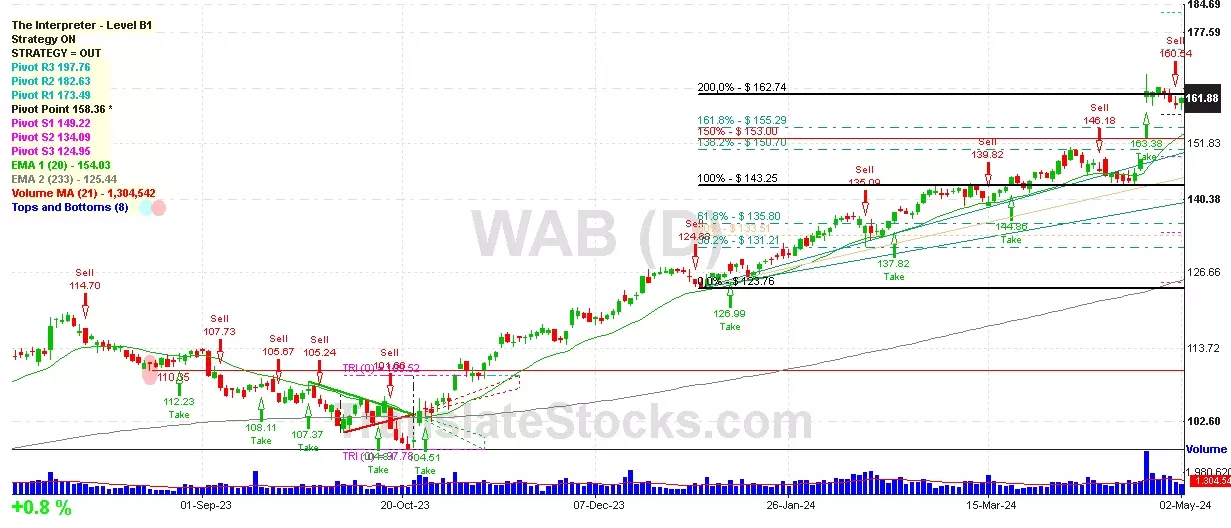
| Simple Moving Averages (SMA) Period | Value $ | Signal | Exponential Moving Averages (EMA) Period | Value $ | Signal | |
|---|---|---|---|---|---|---|
| 2 | 161.21 | BUY | 2 | 161.58 | BUY | |
| 3 | 161.17 | BUY | 3 | 161.52 | BUY | |
| 5 | 162.22 | SELL | 5 | 160.95 | BUY | |
| 8 | 160.77 | BUY | 8 | 159.32 | BUY | |
| 13 | 154.64 | BUY | 13 | 156.72 | BUY | |
| 21 | 152.00 | BUY | 21 | 153.71 | BUY | |
| 34 | 148.95 | BUY | 34 | 150.29 | BUY | |
| 55 | 145.25 | BUY | 55 | 145.99 | BUY | |
| 90 | 139.20 | BUY | 90 | 140.12 | BUY | |
| 200 | 124.00 | BUY | 200 | 127.94 | BUY |
Wabtec Corp
IPO: 1995-06-15
Ticker: WABIndices: S&P 500,
Exchange: New York Stock Exchange, Inc. (US - USD)
Website: https://www.wabtec.com/
Phone:
Common Stock
Manufacturing (
Railroad Equipment

 Click to Enlarge