| Date | Price $ | Result % | Candle Name | Side |
|---|---|---|---|---|
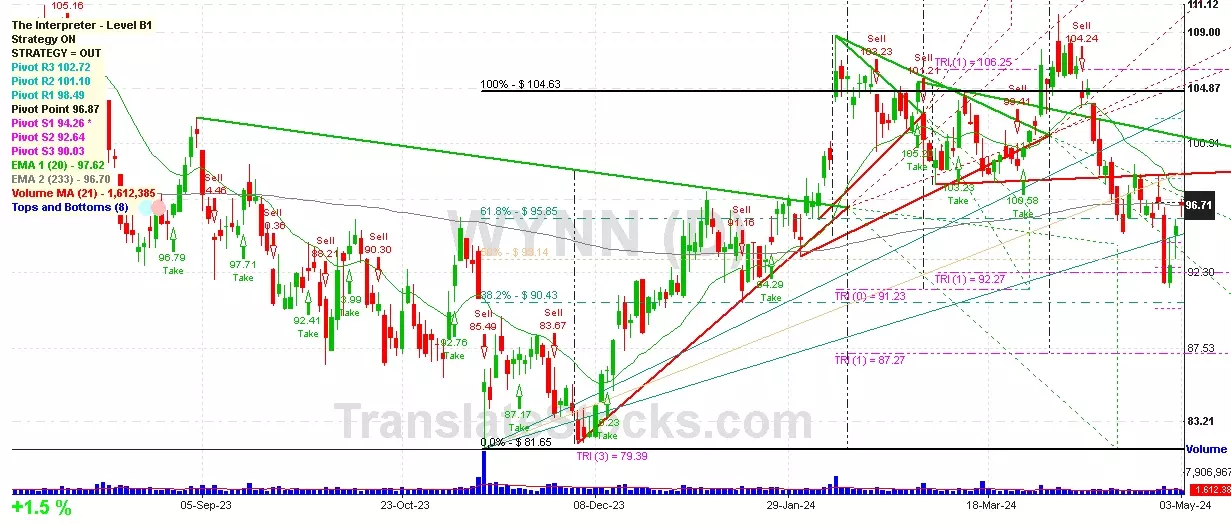
| 001 16 Feb 2024 | Sell Price: 105.13 | Profit: Open Day1 ($ 104.42) | Abandoned Baby | Sell |
| 002 23 Oct 2023 | Buy Price: 89.84 | Profit: Open Day1 ($ 90.41) | Engulfing | Buy |
| 003 05 Oct 2023 | Buy Price: 89.49 | Profit: Close Day1 ($ 92.41) | Piercing Line | Buy |
| 004 15 Sep 2023 | Sell Price: 97.04 | Profit: Open Day2 ($ 96.76) | Dark Cloud Cover | Sell |
| 005 05 Sep 2023 | Sell Price: 97.41 | Profit: Open Day1 ($ 96.65) | Abandoned Baby | Sell |
| 006 21 Aug 2023 | Buy Price: 94.20 | Profit: Open Day1 ($ 95.20) | Abandoned Baby | Buy |
| 007 27 Jul 2023 | Sell Price: 108.15 | Loss: Close Day2 ($ 108.98) | Engulfing | Sell |
| 008 16 Jun 2023 | Sell Price: 103.73 | Loss: Close Day2 ($ 106.35) | Dark Cloud Cover | Sell |
| 009 09 May 2023 | Sell Price: 111.70 | Profit: Close Day1 ($ 111.50) | Abandoned Baby | Sell |
| 010One Year Average | Both Sides Result for 9 Signals |
Profit: $ 2.99 ($ 0.33 / Signal) |
All of Them | Buy + Sell |
| Simple Moving Averages (SMA) Period | Value $ | Signal | Exponential Moving Averages (EMA) Period | Value $ | Signal | |
|---|---|---|---|---|---|---|
| 2 | 95.99 | BUY | 2 | 95.97 | BUY | |
| 3 | 94.90 | BUY | 3 | 95.54 | BUY | |
| 5 | 94.67 | BUY | 5 | 95.33 | BUY | |
| 8 | 95.36 | BUY | 8 | 95.64 | BUY | |
| 13 | 95.98 | BUY | 13 | 96.52 | BUY | |
| 21 | 98.89 | SELL | 21 | 97.75 | SELL | |
| 34 | 100.11 | SELL | 34 | 98.80 | SELL | |
| 55 | 100.92 | SELL | 55 | 99.06 | SELL | |
| 90 | 99.10 | SELL | 90 | 98.46 | SELL | |
| 200 | 95.92 | BUY | 200 | 97.07 | SELL |
Wynn Resorts Ltd
IPO: 2002-10-25
Ticker: WYNNIndices: S&P 500,
Exchange: Nasdaq Nms - Global Market (US - USD)
Website: https://www.wynnresorts.com/
Phone:
Common Stock
Real Estate & Construction (
Hotels & Motels

 Click to Enlarge