| Date | Price $ | Result % | Candle Name | Side |
|---|---|---|---|---|
| 001 23 Apr 2024 | Buy Price: 30.86 | Profit: Close Day1 ($ 30.92) | Engulfing | Buy |
| 002 10 Apr 2024 | Sell Price: 32.39 | Profit: Close Day1 ($ 32.02) | Abandoned Baby | Sell |
| 003 03 Apr 2024 | Buy Price: 31.85 | Profit: Open Day1 ($ 32.05) | Abandoned Baby | Buy |
| 004 18 Mar 2024 | Buy Price: 32.98 | Profit: Open Day1 ($ 33.03) | Abandoned Baby | Buy |
| 005 06 Nov 2023 | Sell Price: 28.56 | Profit: Close Day1 ($ 28.40) | Engulfing | Sell |
| 006 03 Nov 2023 | Buy Price: 29.21 | Profit: Open Day1 ($ 29.31) | Abandoned Baby | Buy |
| 007 18 Aug 2023 | Buy Price: 37.30 | Profit: Open Day1 ($ 37.48) | Piercing Line | Buy |
| 008 25 Jul 2023 | Buy Price: 40.57 | Profit: Open Day2 ($ 40.88) | Piercing Line | Buy |
| 009 24 Jul 2023 | Sell Price: 40.46 | Profit: Open Day1 ($ 40.31) | Engulfing | Sell |
| 010 30 May 2023 | Sell Price: 36.46 | Profit: Open Day1 ($ 36.25) | Engulfing | Sell |
| 011One Year Average | Both Sides Result for 10 Signals |
Profit: $ 1.79 ($ 0.18 / Signal) |
All of Them | Buy + Sell |
| Simple Moving Averages (SMA) Period | Value $ | Signal | Exponential Moving Averages (EMA) Period | Value $ | Signal | |
|---|---|---|---|---|---|---|
| 2 | 30.63 | BUY | 2 | 30.64 | BUY | |
| 3 | 30.54 | BUY | 3 | 30.63 | BUY | |
| 5 | 30.68 | BUY | 5 | 30.63 | BUY | |
| 8 | 30.59 | BUY | 8 | 30.71 | SELL | |
| 13 | 30.77 | SELL | 13 | 30.92 | SELL | |
| 21 | 31.32 | SELL | 21 | 31.28 | SELL | |
| 34 | 32.02 | SELL | 34 | 31.77 | SELL | |
| 55 | 32.54 | SELL | 55 | 32.28 | SELL | |
| 90 | 33.59 | SELL | 90 | 32.80 | SELL | |
| 200 | 34.10 | SELL | 200 | 33.95 | SELL |
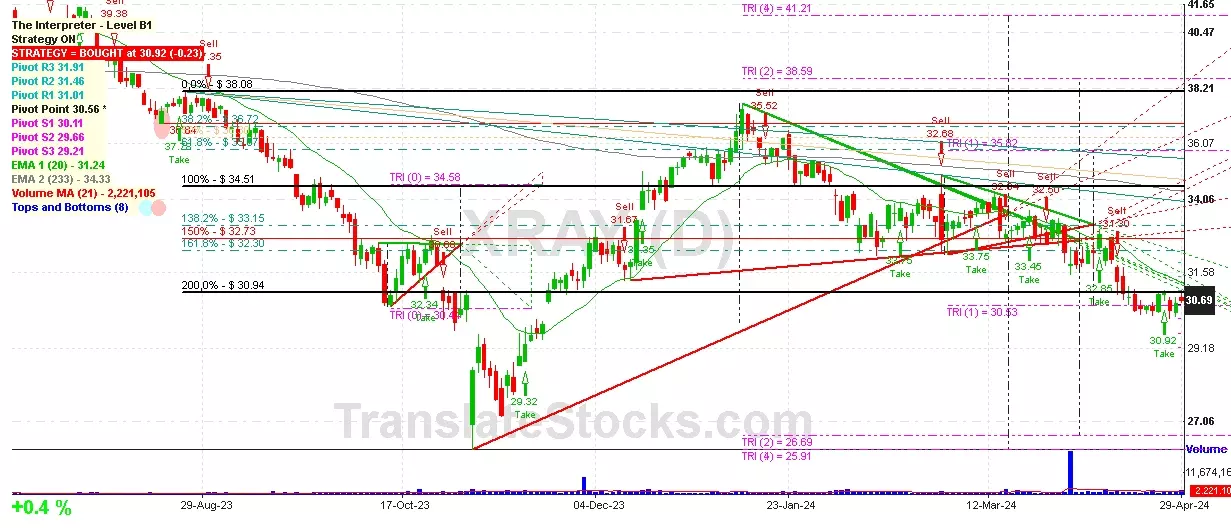
Dentsply Sirona Inc
IPO: 1987-08-12
Ticker: XRAYIndices: S&P 500,
Exchange: Nasdaq Nms - Global Market (US - USD)
Website: https://www.dentsplysirona.com/
Phone:
Common Stock
Life Sciences (
Dental Equipment & Supplies

 Click to Enlarge