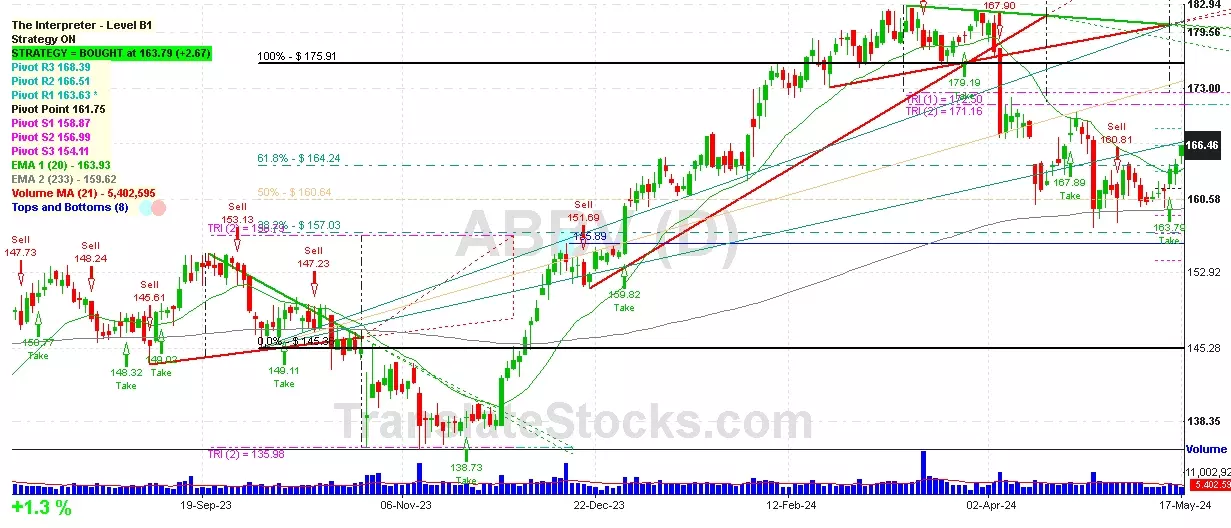
Hey Friend, I'm analysing ABBVIE INC (ABBV), and it is between the Support of $ 164.24 (61.8% of Fibonacci) and the Resistance of $ 166.51 (PivotR2). The stock is also approaching the line of PivotR2 at $ 166.51, and if it goes above this line it could reach the next Resistance of Triangle projection at $171.16.

| Date | Price $ | Result % | Candle Name | Side |
|---|---|---|---|---|
| 001 13 Mar 2024 | Sell Price: 179.86 | Profit: Open Day2 ($ 179.84) | Dark Cloud Cover | Sell |
| 002 11 Mar 2024 | Buy Price: 179.63 | Profit: Open Day1 ($ 179.72) | Piercing Line | Buy |
| 003 03 Nov 2023 | Sell Price: 141.42 | Profit: Close Day1 ($ 141.20) | Dark Cloud Cover | Sell |
| 004 04 Oct 2023 | Buy Price: 148.01 | Profit: Close Day2 ($ 148.24) | Engulfing | Buy |
| 005 04 Oct 2023 | Buy Price: 147.69 | Profit: Open Day1 ($ 147.93) | Piercing Line | Buy |
| 006 15 Aug 2023 | Sell Price: 152.12 | Profit: Close Day1 ($ 151.55) | Abandoned Baby | Sell |
| 007 29 Jun 2023 | Buy Price: 133.23 | Profit: Open Day1 ($ 133.47) | Engulfing | Buy |
| 008One Year Average | Both Sides Result for 7 Signals |
Profit: $ 1.61 ($ 0.23 / Signal) |
All of Them | Buy + Sell |
| Simple Moving Averages (SMA) Period | Value $ | Signal | Exponential Moving Averages (EMA) Period | Value $ | Signal | |
|---|---|---|---|---|---|---|
| 2 | 165.41 | BUY | 2 | 165.60 | BUY | |
| 3 | 164.87 | BUY | 3 | 164.95 | BUY | |
| 5 | 163.49 | BUY | 5 | 164.06 | BUY | |
| 8 | 162.38 | BUY | 8 | 163.43 | BUY | |
| 13 | 162.36 | BUY | 13 | 163.29 | BUY | |
| 21 | 163.49 | BUY | 21 | 164.04 | BUY | |
| 34 | 165.33 | BUY | 34 | 165.65 | BUY | |
| 55 | 170.68 | SELL | 55 | 166.91 | SELL | |
| 90 | 170.52 | SELL | 90 | 166.19 | BUY | |
| 200 | 158.30 | BUY | 200 | 160.94 | BUY |
Abbvie Inc
IPO: 2013-01-02
Ticker: ABBVIndices: S&P 500,
Exchange: New York Stock Exchange, Inc. (US - USD)
Website: https://www.abbvie.com/
Phone:
Common Stock
Life Sciences (
Pharmaceutical Preparations
 Click to Enlarge