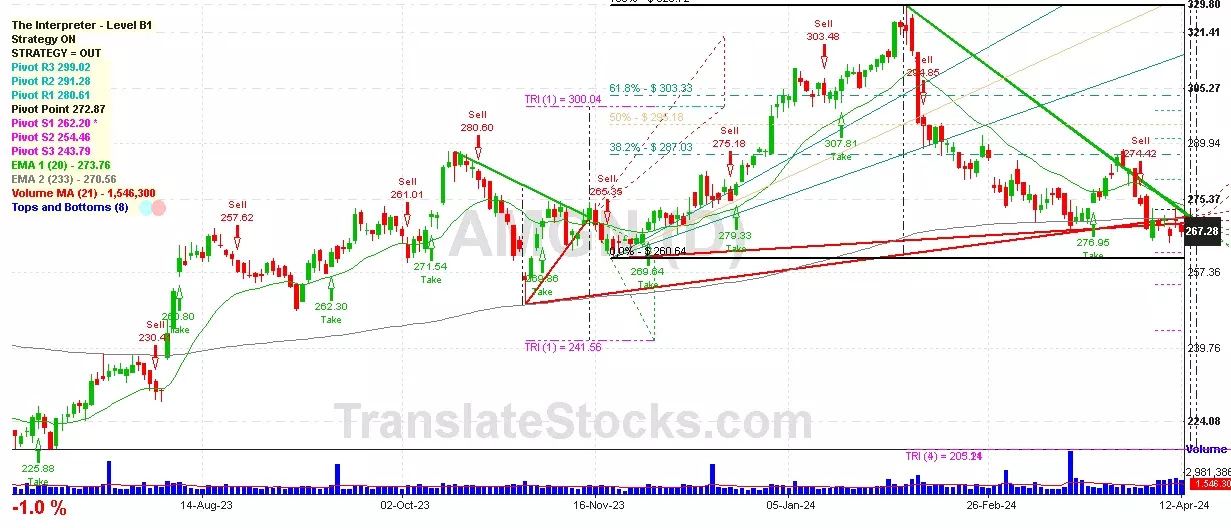
Hey Friend, I'm analysing AMGEN INC (AMGN), and it is between the Support of $ 262.20 (PivotS1) and the Resistance of $ 272.87 (Pivot). The stock is also approaching the line of PivotS1 at $ 262.20, and if it goes below this line it could reach the next Support of 0% of Fibonacci at $ 260.64.

| Date | Price $ | Result % | Candle Name | Side |
|---|---|---|---|---|
| 001 22 Mar 2024 | Sell Price: 276.17 | Loss: Close Day2 ($ 281.77) | Dark Cloud Cover | Sell |
| 002 15 Sep 2023 | Sell Price: 260.72 | Loss: Close Day2 ($ 264.31) | Dark Cloud Cover | Sell |
| 003 20 Jun 2023 | Sell Price: 228.59 | Profit: Open Day1 ($ 228.18) | Abandoned Baby | Sell |
| 004One Year Average | Both Sides Result for 3 Signals |
Loss: $ -8.78 ($ -2.93 / Signal) |
All of Them | Buy + Sell |
| Simple Moving Averages (SMA) Period | Value $ | Signal | Exponential Moving Averages (EMA) Period | Value $ | Signal | |
|---|---|---|---|---|---|---|
| 2 | 269.68 | BUY | 2 | 270.16 | SELL | |
| 3 | 270.79 | SELL | 3 | 270.38 | SELL | |
| 5 | 271.56 | SELL | 5 | 270.29 | SELL | |
| 8 | 269.20 | BUY | 8 | 269.96 | BUY | |
| 13 | 268.34 | BUY | 13 | 270.02 | SELL | |
| 21 | 270.67 | SELL | 21 | 271.02 | SELL | |
| 34 | 272.65 | SELL | 34 | 273.38 | SELL | |
| 55 | 276.74 | SELL | 55 | 276.51 | SELL | |
| 90 | 286.54 | SELL | 90 | 278.00 | SELL | |
| 200 | 272.85 | SELL | 200 | 272.44 | SELL |
Amgen Inc
IPO: 1987-05-01
Ticker: AMGNIndices: Dow 30,
S&P 500,
Nasdaq 100,
Exchange: Nasdaq Nms - Global Market (US - USD)
Website: http://www.amgen.com
Phone:
Common Stock
Life Sciences (
Biological Products, (no Disgnostic Substances)
 Click to Enlarge