| Date | Price $ | Result % | Candle Name | Side |
|---|---|---|---|---|
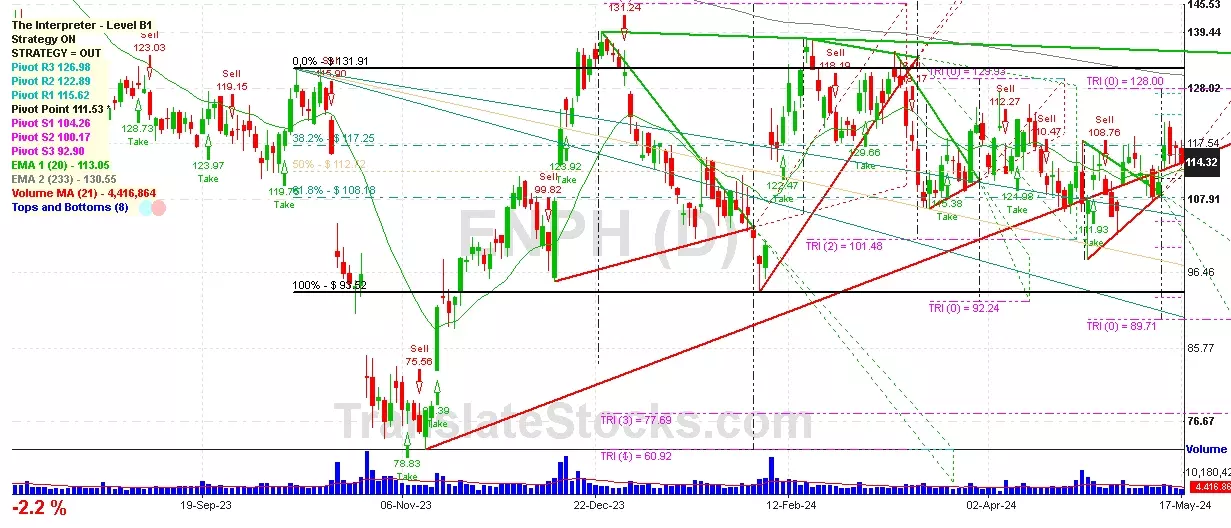
| 001 01 Apr 2024 | Sell Price: 118.29 | Profit: Open Day1 ($ 115.45) | Engulfing | Sell |
| 002 22 Jan 2024 | Buy Price: 107.15 | Profit: Open Day1 ($ 113.17) | Abandoned Baby | Buy |
| 003 26 Oct 2023 | Buy Price: 96.18 | Loss: Close Day2 ($ 78.66) | Abandoned Baby | Buy |
| 004 16 Oct 2023 | Buy Price: 127.11 | Profit: Close Day1 ($ 129.24) | Engulfing | Buy |
| 005One Year Average | Both Sides Result for 4 Signals |
Loss: $ -6.53 ($ -1.63 / Signal) |
All of Them | Buy + Sell |
| Simple Moving Averages (SMA) Period | Value $ | Signal | Exponential Moving Averages (EMA) Period | Value $ | Signal | |
|---|---|---|---|---|---|---|
| 2 | 115.59 | SELL | 2 | 114.99 | SELL | |
| 3 | 115.55 | SELL | 3 | 115.03 | SELL | |
| 5 | 114.91 | SELL | 5 | 114.64 | SELL | |
| 8 | 113.30 | BUY | 8 | 113.99 | BUY | |
| 13 | 112.45 | BUY | 13 | 113.31 | BUY | |
| 21 | 111.51 | BUY | 21 | 113.05 | BUY | |
| 34 | 113.14 | BUY | 34 | 113.44 | BUY | |
| 55 | 115.28 | SELL | 55 | 114.11 | BUY | |
| 90 | 115.14 | SELL | 90 | 115.15 | SELL | |
| 200 | 114.88 | SELL | 200 | 126.16 | SELL |
Enphase Energy Inc
IPO: 2012-03-30
Ticker: ENPHIndices: S&P 500,
Exchange: Nasdaq Nms - Global Market (US - USD)
Website: https://enphase.com/
Phone:
Common Stock
Manufacturing (
Semiconductors & Related Devices

 Click to Enlarge