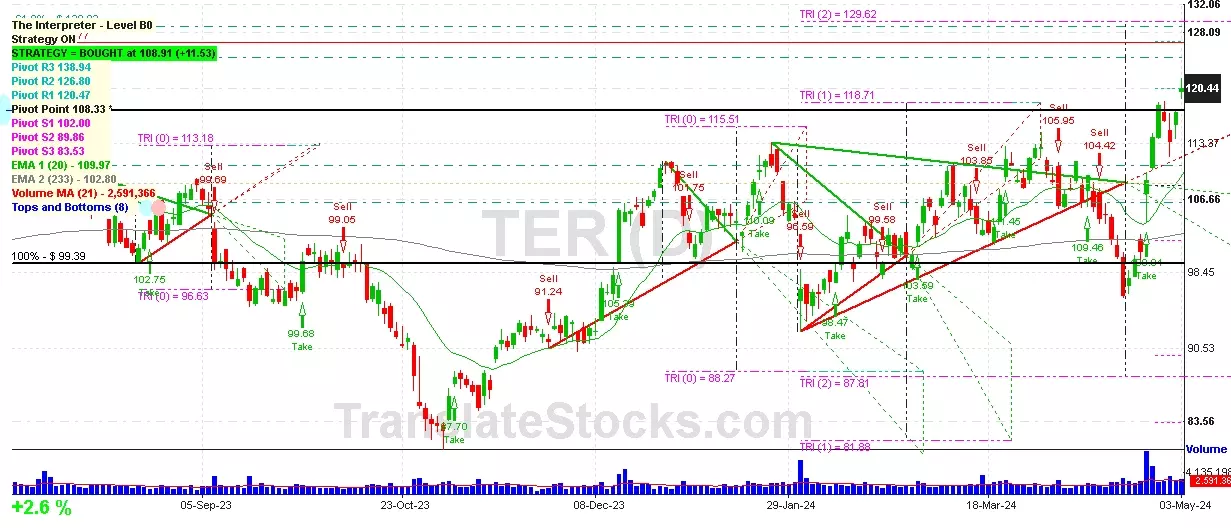
Hey Friend, I'm analysing TERADYNE INC (TER), and it is between the Support of $ 118.71 (Triangle Projection Level 1) and the Resistance of $ 120.47 (PivotR1). The stock is also approaching the line of PivotR1 at $ 120.47, and if it goes above this line it could reach the next Resistance of -38.2% of Fibonacci at $ 124.61.

| Date | Price $ | Result % | Candle Name | Side |
|---|---|---|---|---|
| 001 02 Apr 2024 | Sell Price: 110.14 | Profit: Open Day1 ($ 108.96) | Abandoned Baby | Sell |
| 002 23 Feb 2024 | Sell Price: 100.14 | Loss: Close Day2 ($ 100.27) | Engulfing | Sell |
| 003 05 Jan 2024 | Buy Price: 102.77 | Profit: Open Day1 ($ 103.18) | Abandoned Baby | Buy |
| 004 05 Sep 2023 | Sell Price: 106.62 | Profit: Open Day1 ($ 106.02) | Abandoned Baby | Sell |
| 005 18 Aug 2023 | Buy Price: 101.06 | Profit: Open Day1 ($ 101.11) | Piercing Line | Buy |
| 006 08 Aug 2023 | Sell Price: 106.27 | Profit: Open Day1 ($ 106.19) | Abandoned Baby | Sell |
| 007 26 Jul 2023 | Sell Price: 114.64 | Profit: Close Day1 ($ 110.62) | Abandoned Baby | Sell |
| 008 05 Jul 2023 | Sell Price: 108.09 | Profit: Open Day1 ($ 106.50) | Abandoned Baby | Sell |
| 009 22 Jun 2023 | Buy Price: 107.80 | Loss: Close Day2 ($ 105.99) | Engulfing | Buy |
| 010 22 Jun 2023 | Buy Price: 107.53 | Loss: Close Day2 ($ 105.99) | Piercing Line | Buy |
| 011 16 Jun 2023 | Buy Price: 111.06 | Loss: Close Day2 ($ 106.89) | Abandoned Baby | Buy |
| 012One Year Average | Both Sides Result for 11 Signals |
Profit: $ 0.28 ($ 0.03 / Signal) |
All of Them | Buy + Sell |
| Simple Moving Averages (SMA) Period | Value $ | Signal | Exponential Moving Averages (EMA) Period | Value $ | Signal | |
|---|---|---|---|---|---|---|
| 2 | 118.92 | BUY | 2 | 119.11 | BUY | |
| 3 | 117.19 | BUY | 3 | 118.17 | BUY | |
| 5 | 117.24 | BUY | 5 | 116.42 | BUY | |
| 8 | 113.74 | BUY | 8 | 114.10 | BUY | |
| 13 | 108.14 | BUY | 13 | 111.67 | BUY | |
| 21 | 107.77 | BUY | 21 | 109.81 | BUY | |
| 34 | 108.18 | BUY | 34 | 108.37 | BUY | |
| 55 | 106.49 | BUY | 55 | 106.95 | BUY | |
| 90 | 105.52 | BUY | 90 | 105.30 | BUY | |
| 200 | 101.70 | BUY | 200 | 102.94 | BUY |
Teradyne Inc
IPO: 1979-05-15
Ticker: TERIndices: S&P 500,
Exchange: Nasdaq Nms - Global Market (US - USD)
Website: http://www.teradyne.com
Phone:
Common Stock
Life Sciences (
Instruments For Meas & Testing Of Electricity & Elec Signals
 Click to Enlarge